Get to know your ManageWP dashboard
- The ManageWP Dashboard has been created to maximize functionality, save you time and make the user experience enjoyable.
In this article
- Get to know your ManageWP dashboard layout
- How to get your ManageWP dashboard organized
- Get to know the Overview tab
- Get to know your Website tab
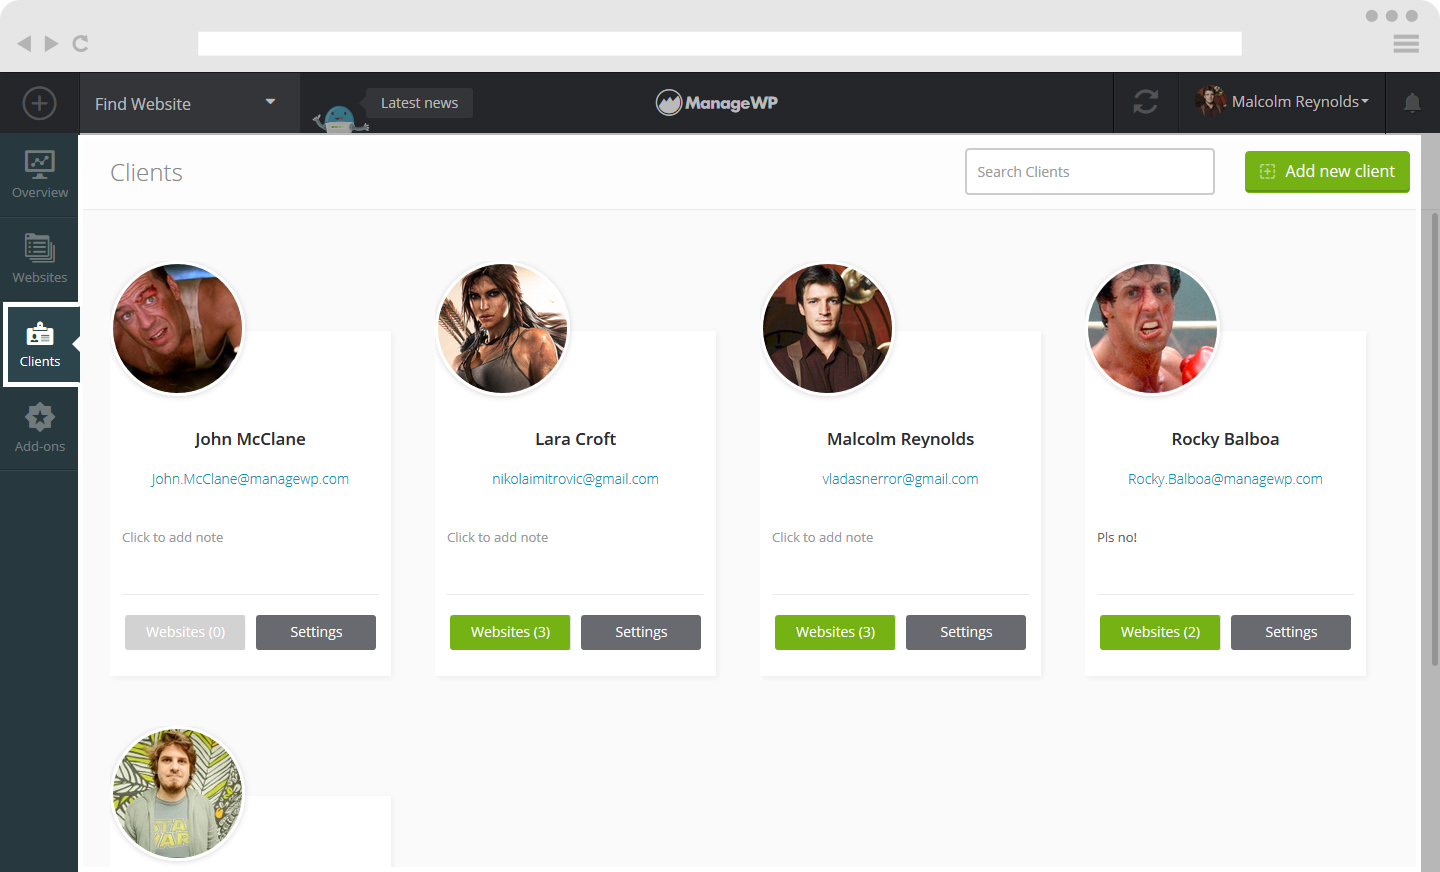
- Get to know your clients tab
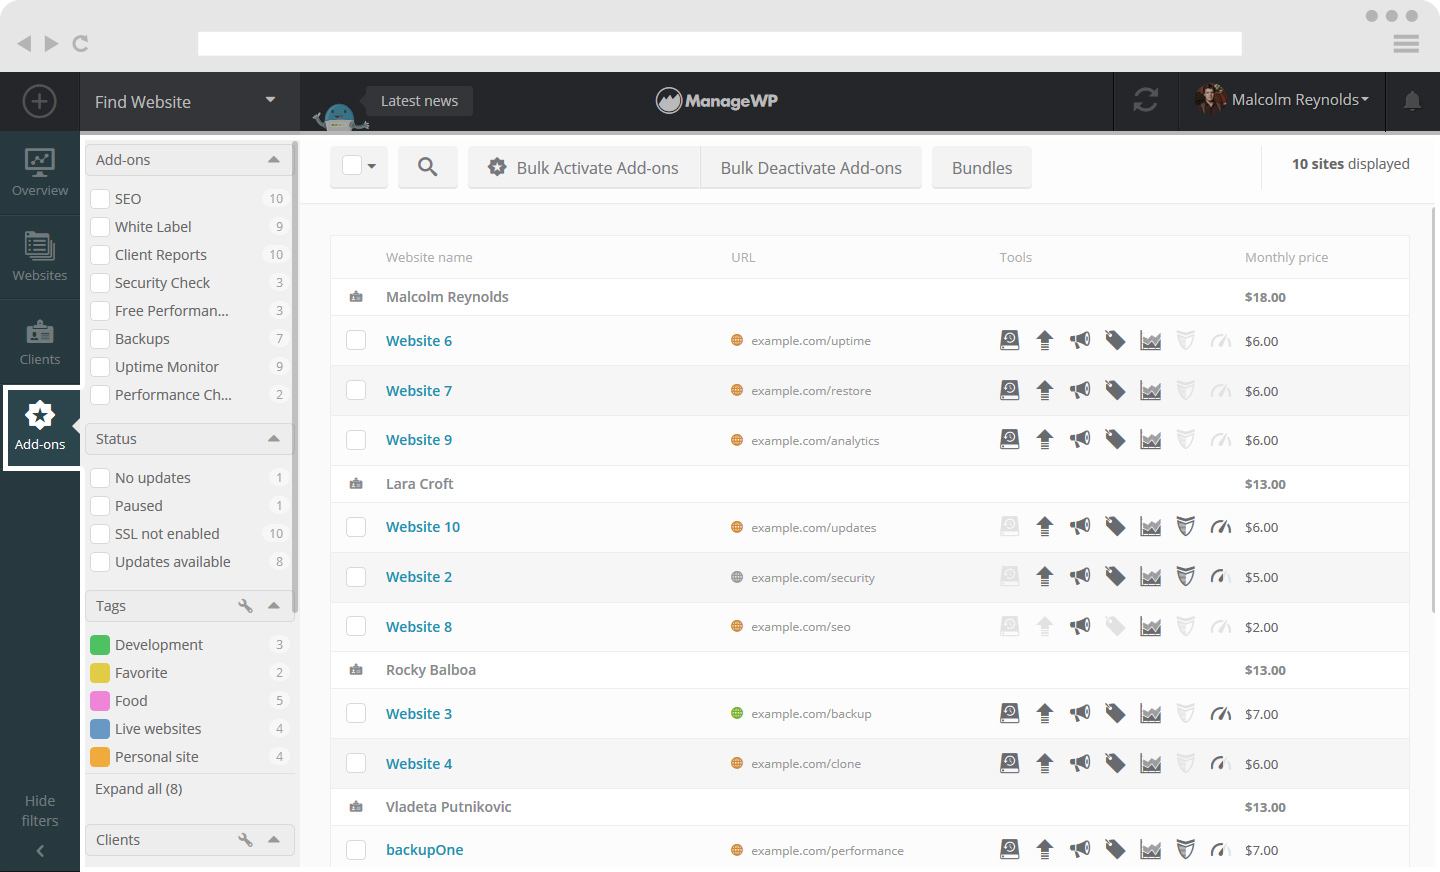
- Get to know your add-ons tab
Get to know your ManageWP dashboard layout
When you login to your ManageWP dashboard on the right hand corner of the top bar you will see your Login Details and if you click on them, underneath you will get a set of options.
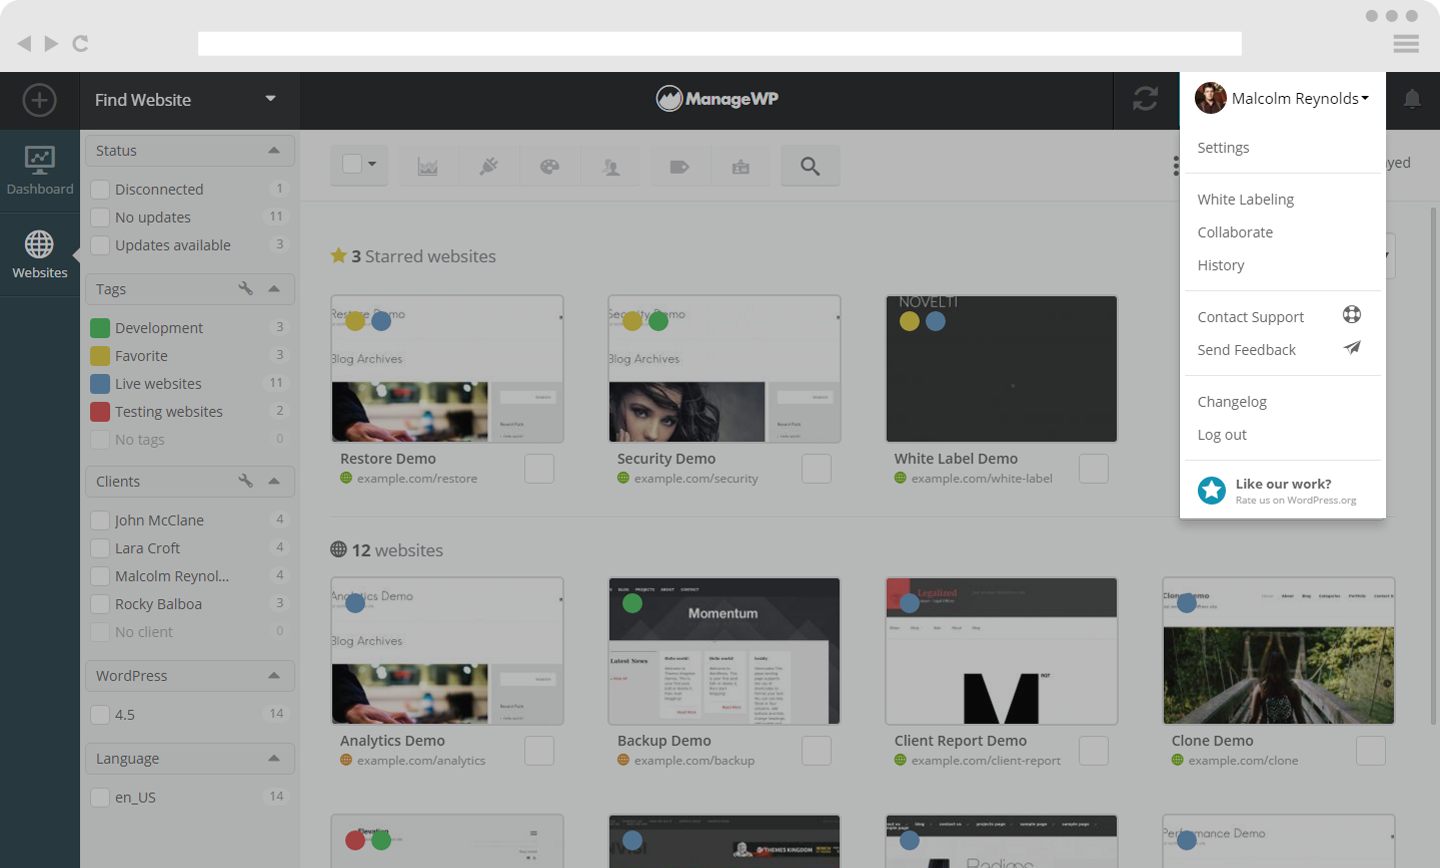
Next to the login options, on the left hand side you will see a double arrow icon, this is your Syncing Icon, telling you when the last time your websites were synchronized. When you first login to your dashboard, you will see a progress bar next to this icon. At any time you wish to sync, simply click this icon.
On the right side of the Login Details, you will see a Bell icon. This is your Notification Icon. If you have pending notifications, the Bell will be orange.
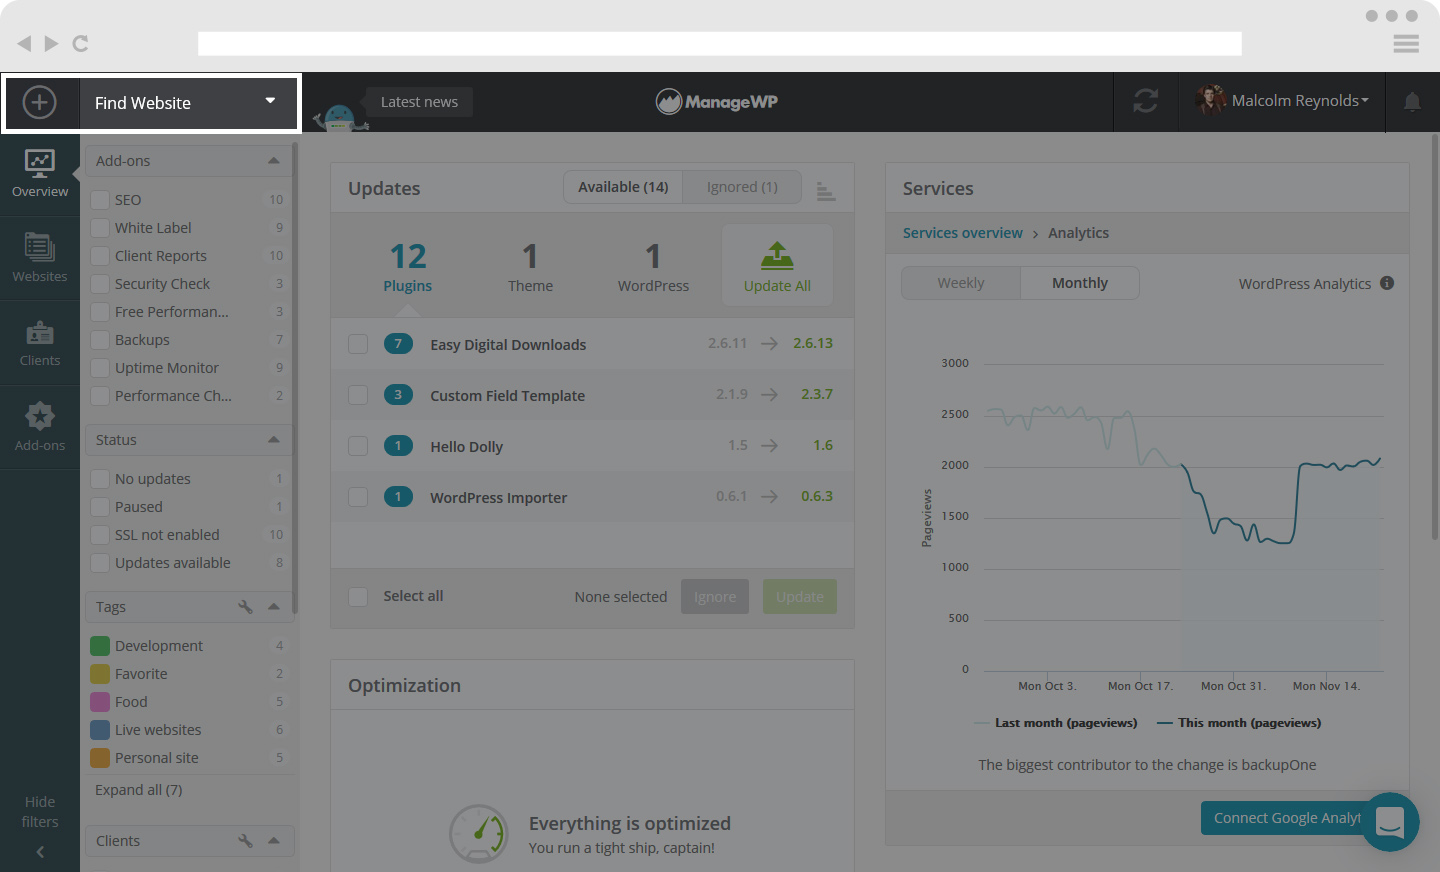
On the left hand side of the top bar, you will notice a Plus sign, this icon is your Add Website Icon, that allows you to add websites to the ManageWP dashboard.
Next to the Add Website Icon, there is a Find Website Box, this will give you a drop down menu with a list of your websites. Here you can also search for a particular website.
Underneath the Add Website Icon, you will see Overview, Websites, Clients and Add-ons tab.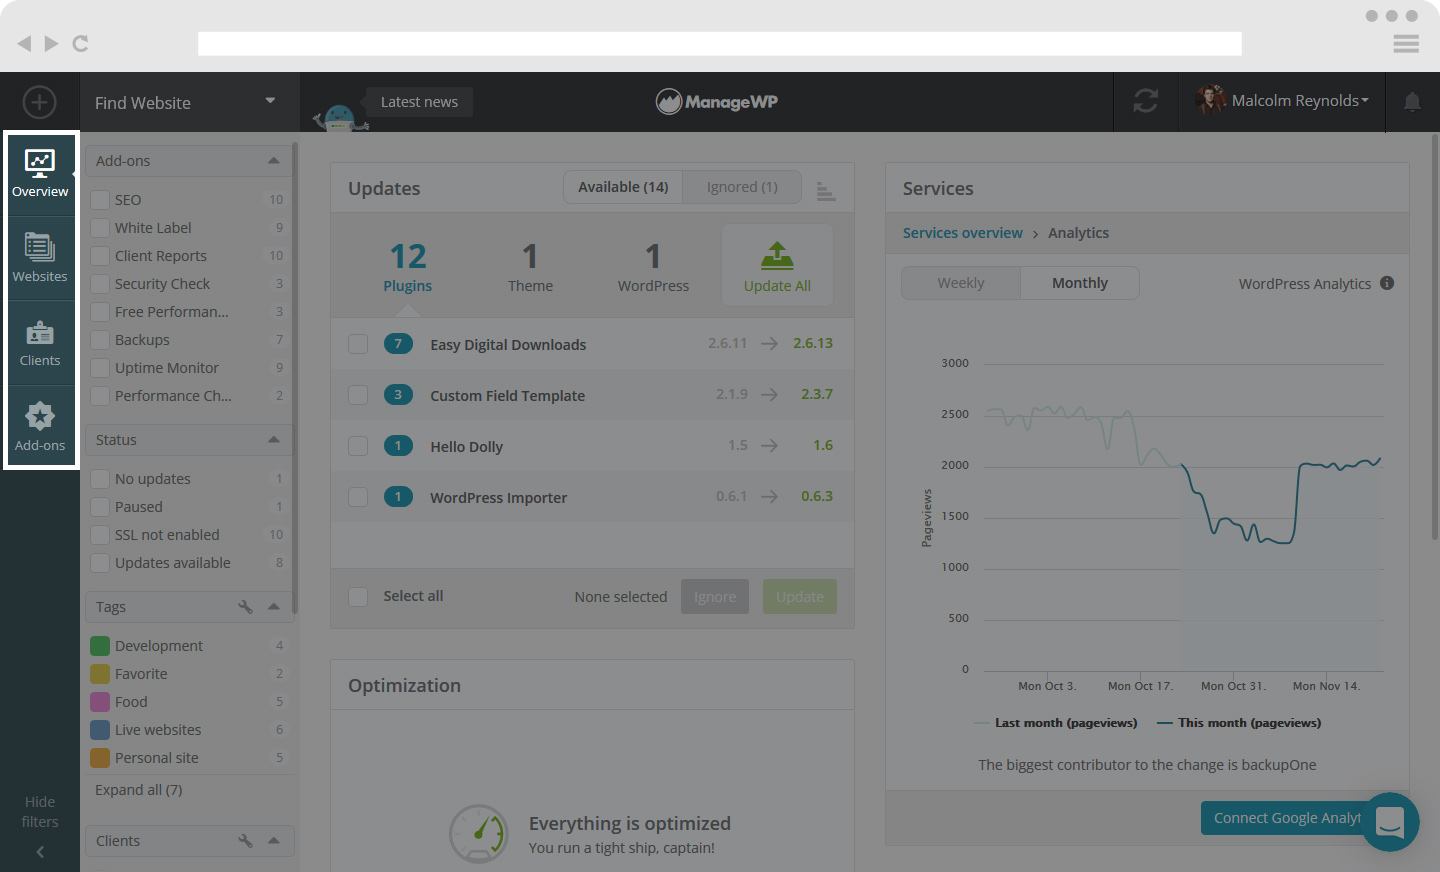
How to get your ManageWP dashboard organized
A great ManageWP feature is the Sidebar that helps you organize your websites. It is located underneath the Find Website Box.
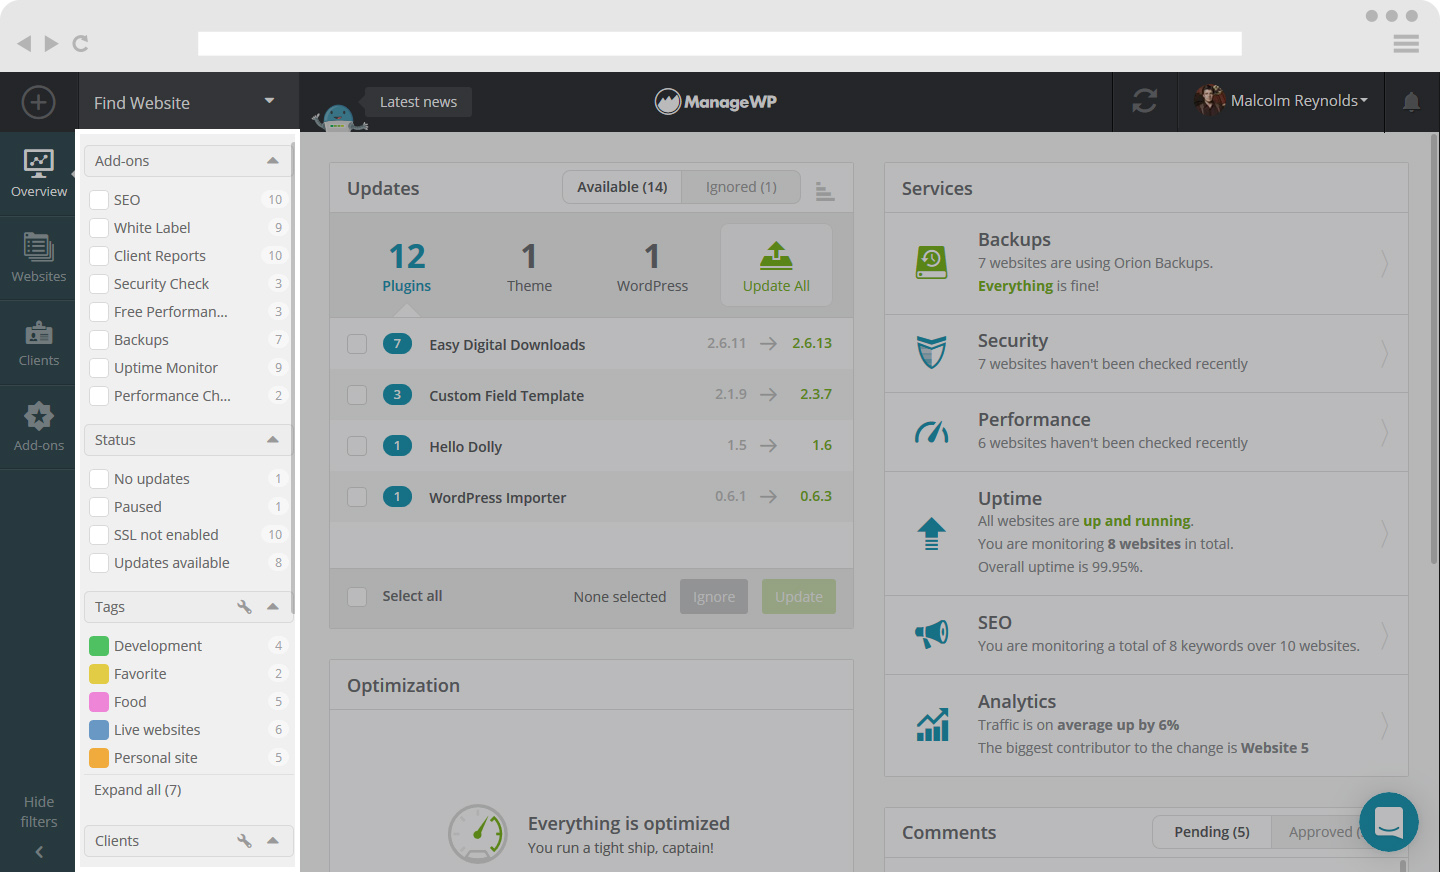
The first option selects sites per activated Premium Add-ons.
Next option is Website Status. Here you will be able to see which websites don’t have updates, which are paused and which have updates available. Here you can also select Websites that are disconnected.
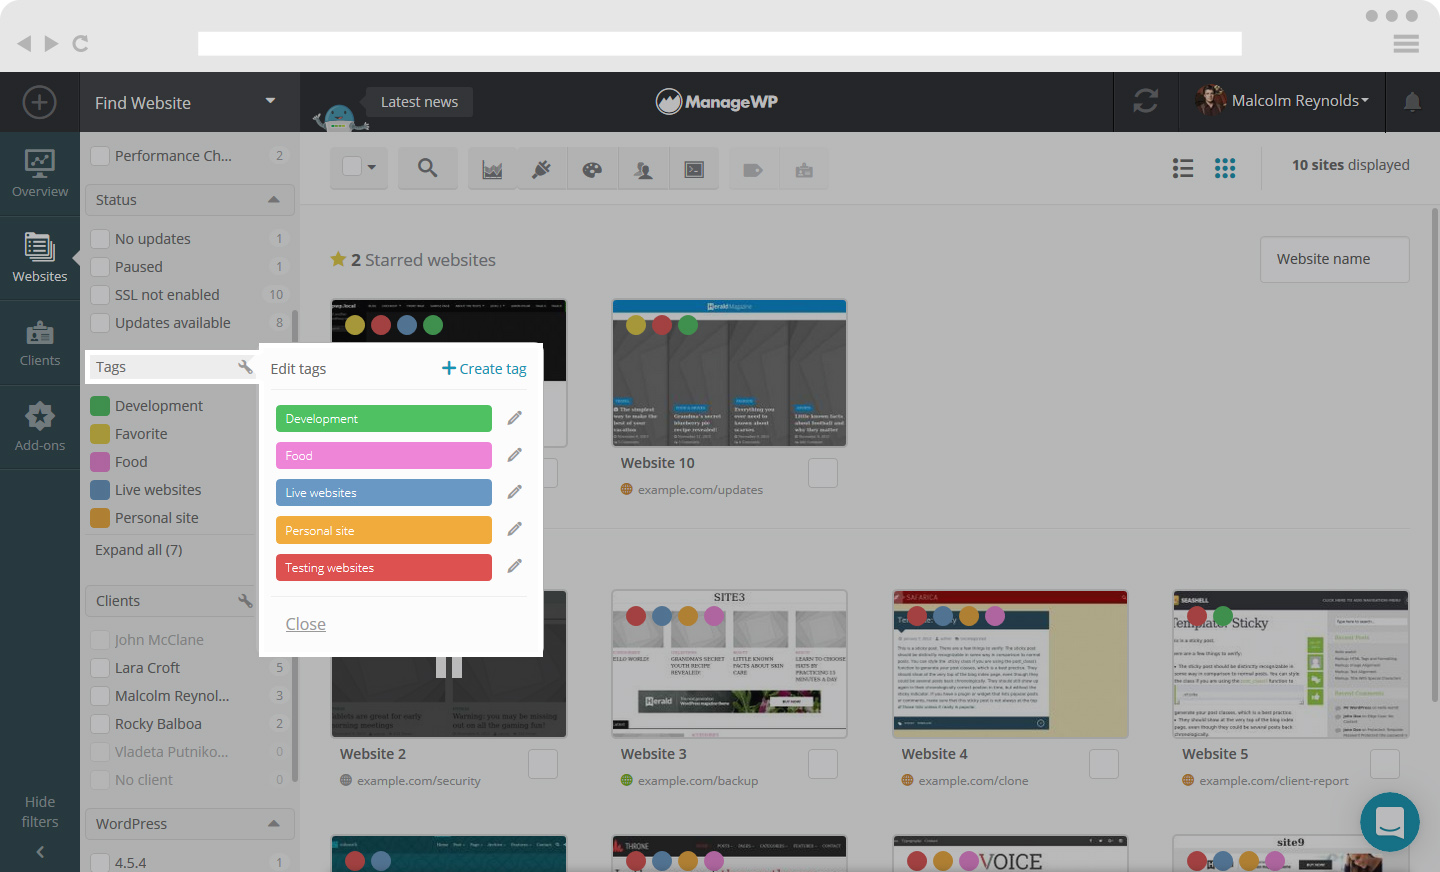
The Sidebar also lets you organize your Tags. You can create tags by clicking on the key wrench and Create tag. Here you also edit already existing tags by clicking on the pen icon.
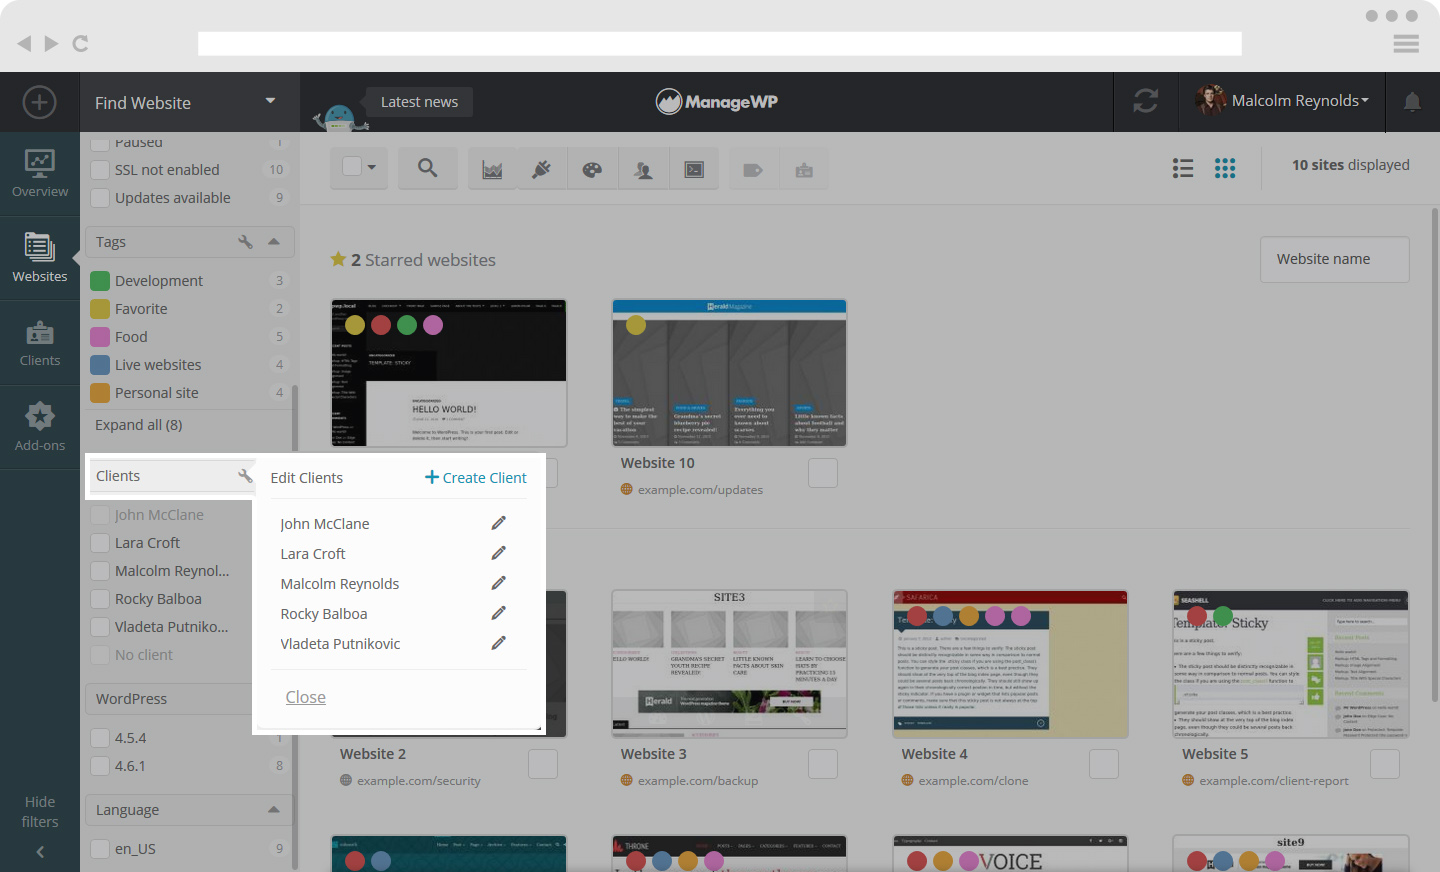
Adding Clients is also easy with the Sidebar just by clicking on Create Client or you can edit an existing client by clicking on the pen icon next to the clients name.
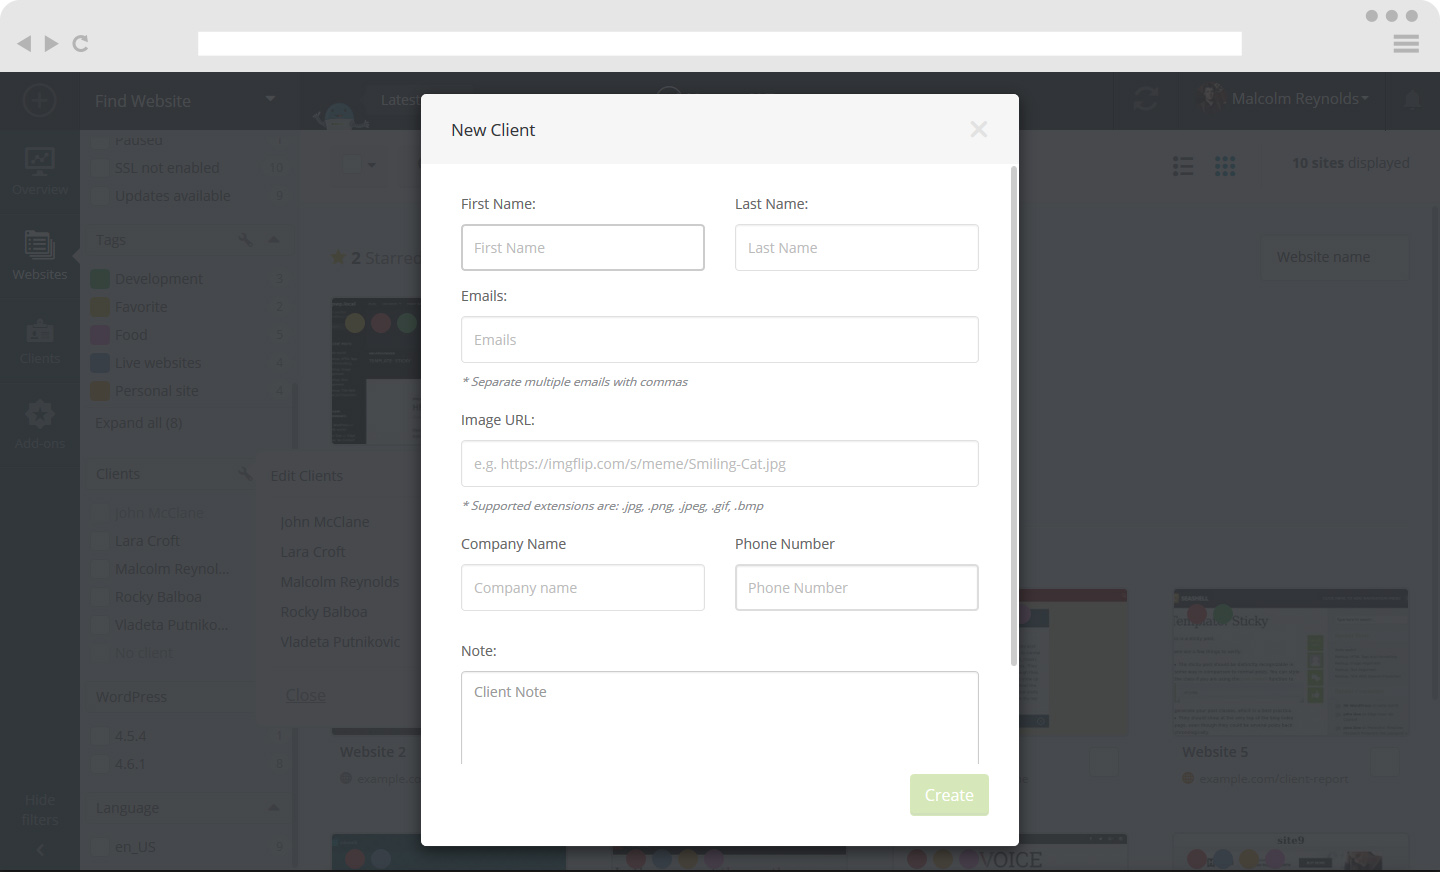
When creating a new client you can input information about your Clients – name, email, add Logo image, Company name, Phone Number and write a note about your Client.
The Sidebar allows you to also view WordPress versions, as well as Language options.
Get to know the overview tab
Overview tab shows Updates, Services, Optimization and Comments widgets. You can drag and drop widgets to switch places on the dashboard.
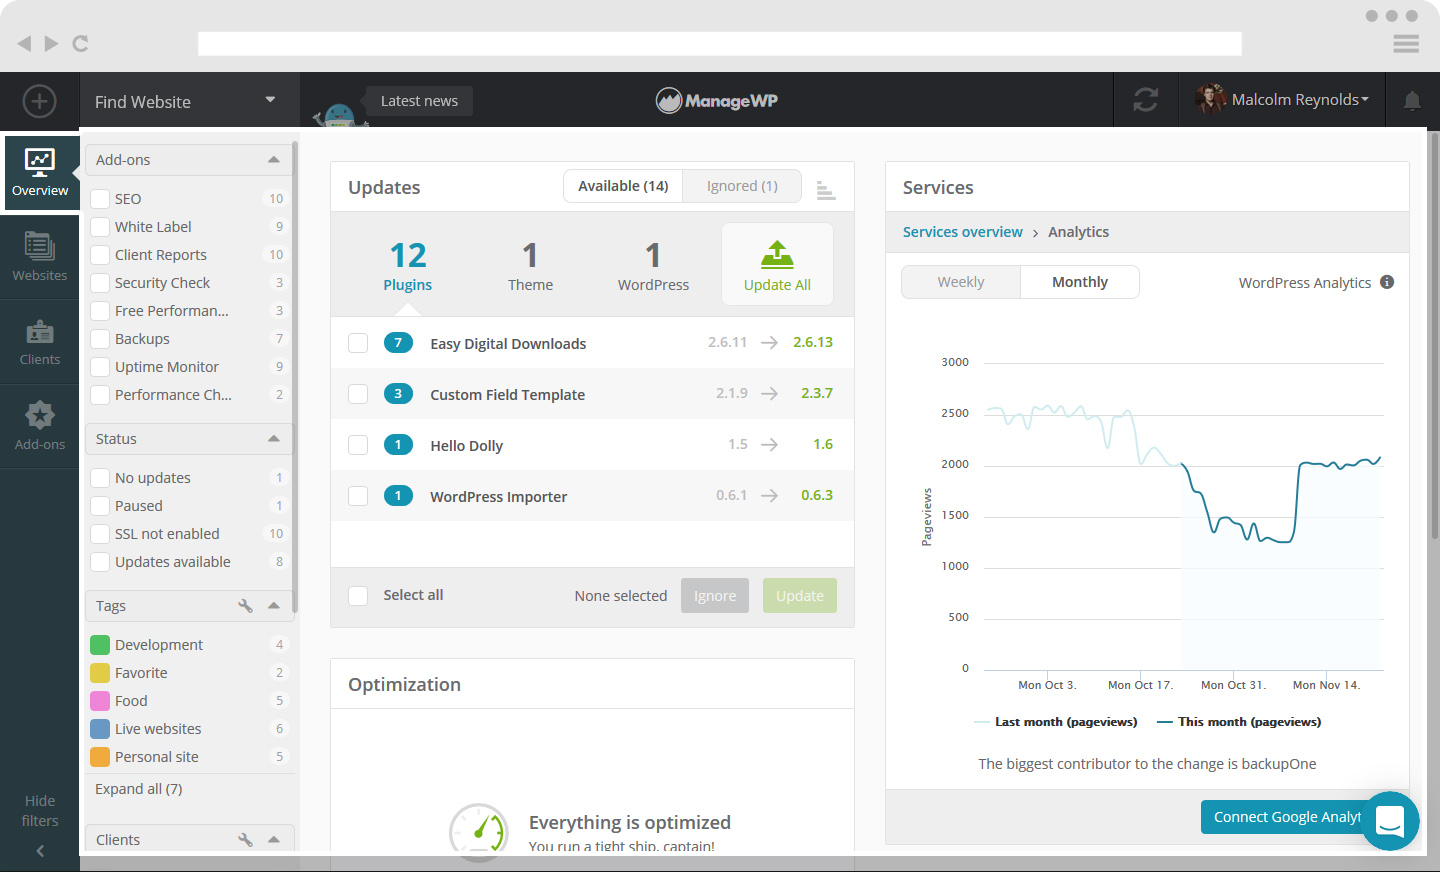
Update Widget
You can have an overview of all of the available updates on your websites. Here you can see available updates for Plugins, Themes and WordPress. There is also the option to Update All.
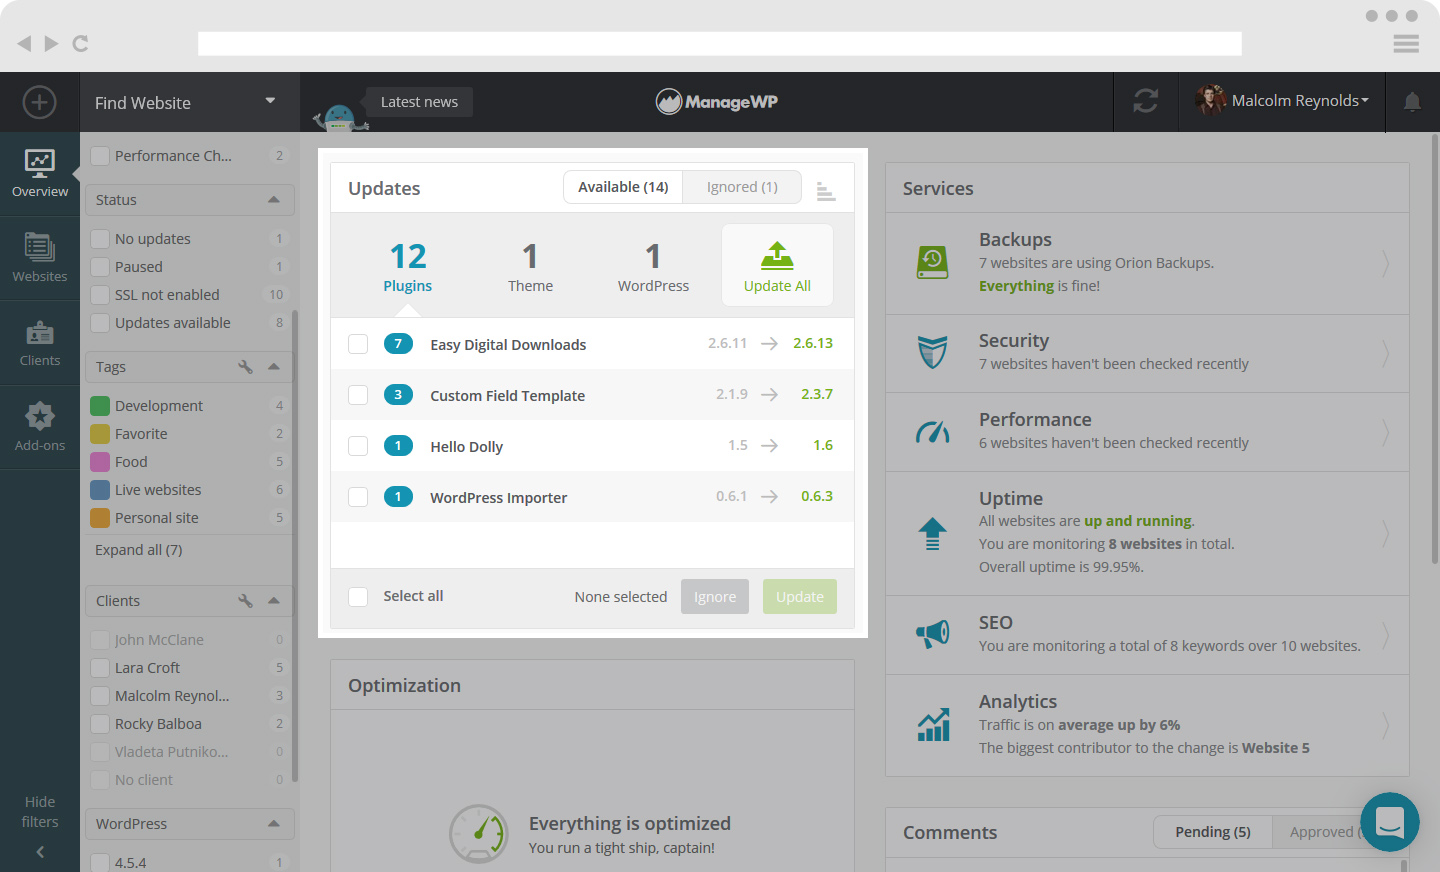
The default option is grouping your updates by Plugin/Theme, however you can adjust this and group the updates by website. You do this by clicking on the icon in the top right hand corner of the Updates Widget.
You can also select individual Websites/Plugins/Themes and either update or ignore them.
Optimization Widget
You can use the Optimization Widget to tidy up your website post revisions and spam comments, as well as MB Overhead. Having too much spam, overhead, and/or post revisions, can increase the weight on your database which will slow down your website over time.
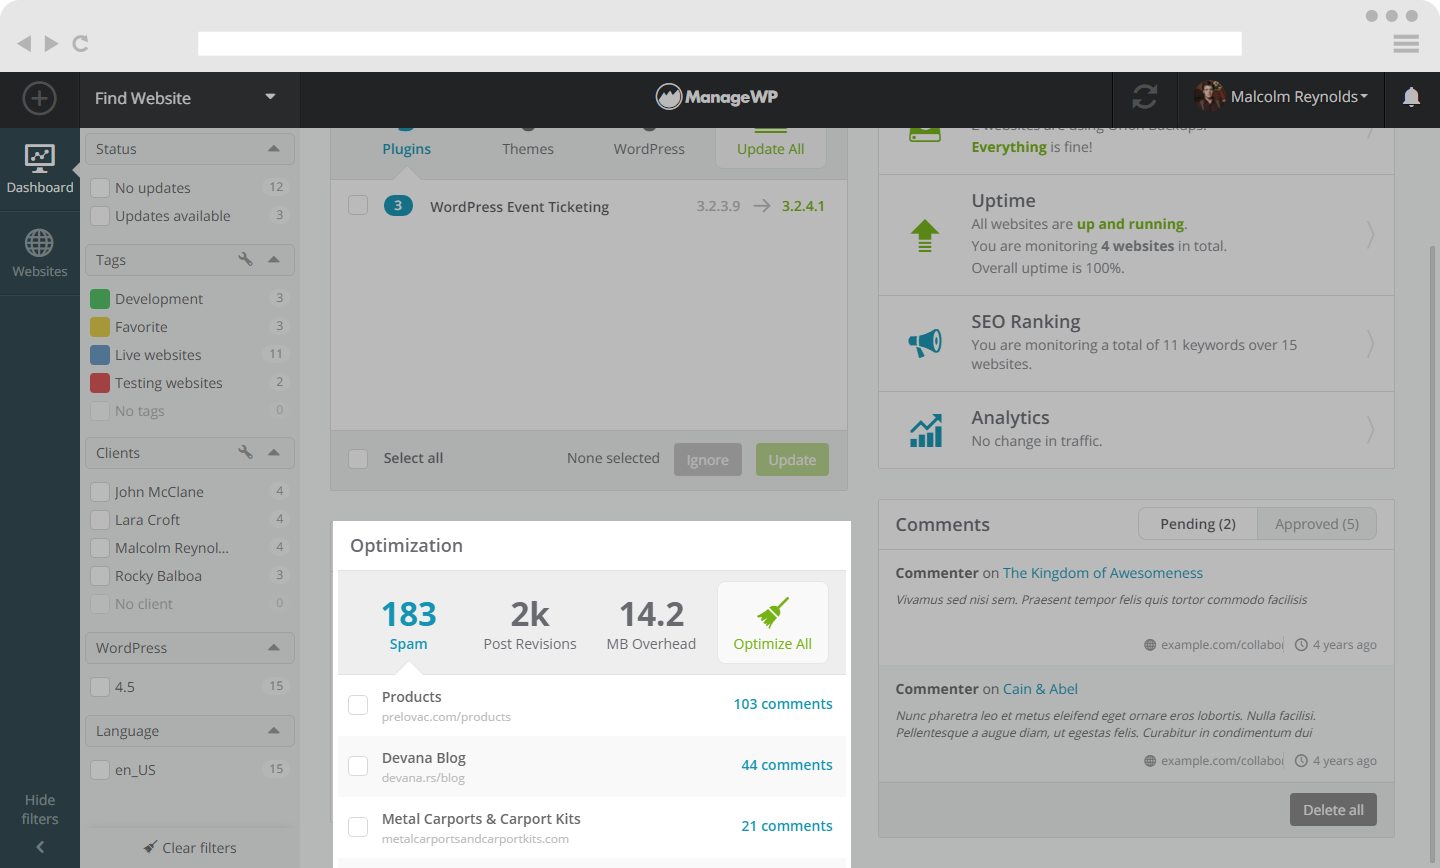
Here you can select exactly what you wish to optimize and what websites to perform this action on. You also have the option of selecting Optimize All.
If you want to change the number of post revisions to keep, you can set this in Advanced Settings.
Services Widget
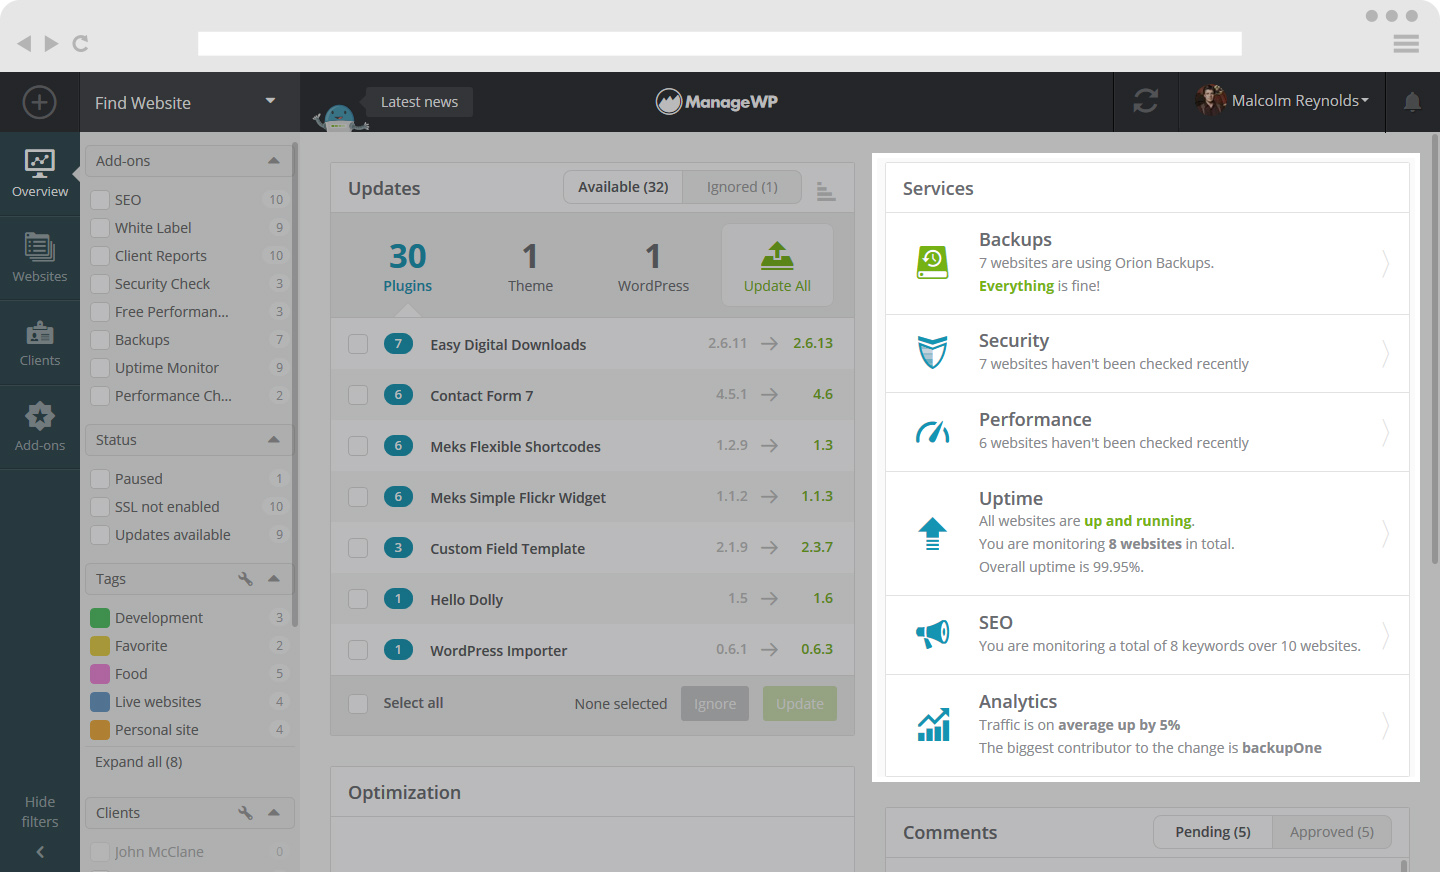
This widget allows you to have an overview of your Backups, Security, Performance, Uptime, SEO and Analytics for your websites. At a glance you will see all the important information concerning your websites.
You can click on each feature to see more details.
Backups
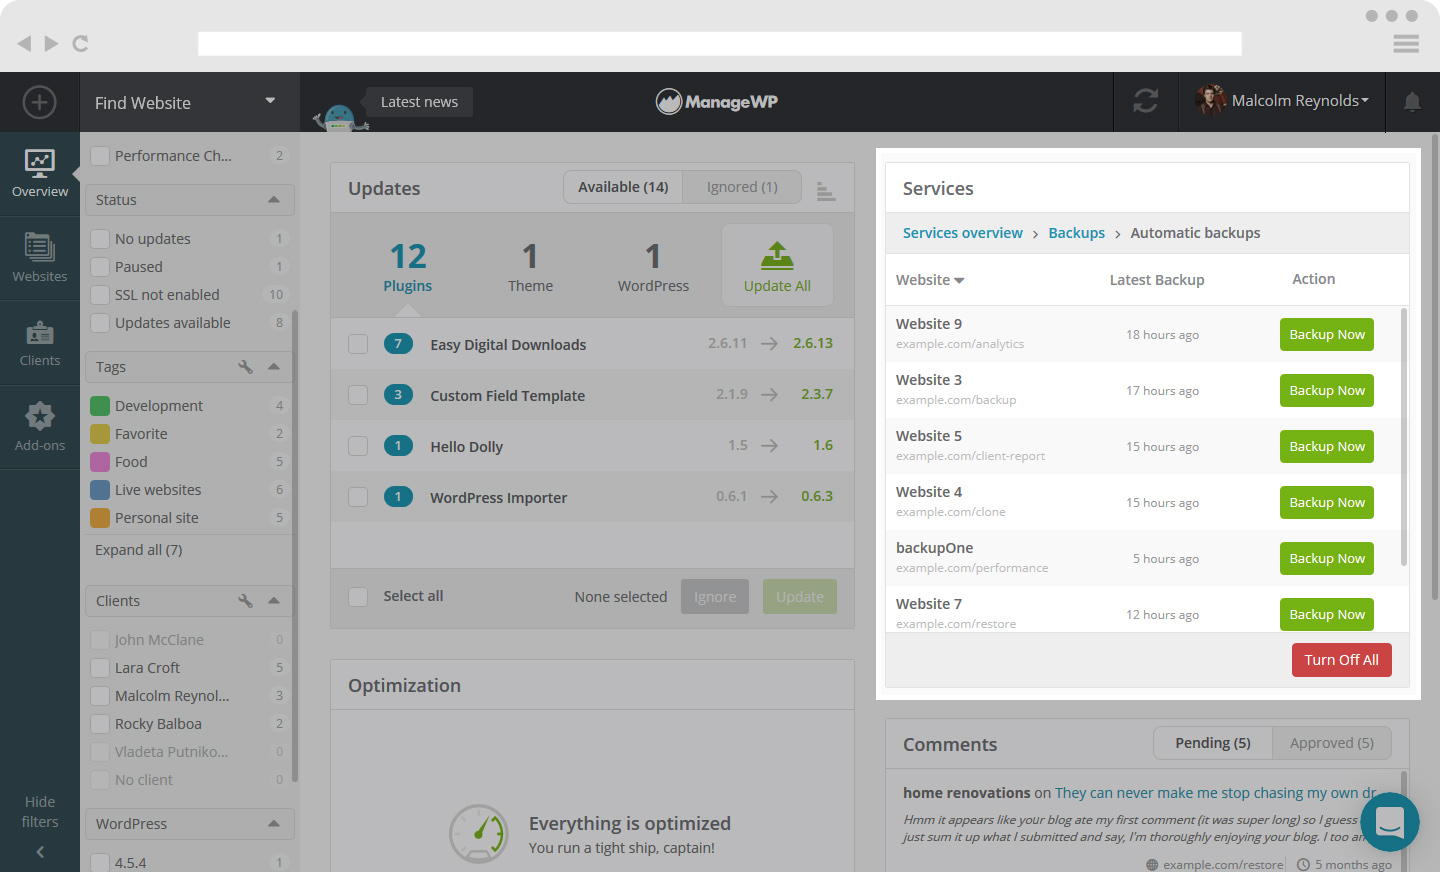
In the example below we have clicked the Backup feature, the next display window is the overview. This shows you an overview of all your websites and their Backup status.
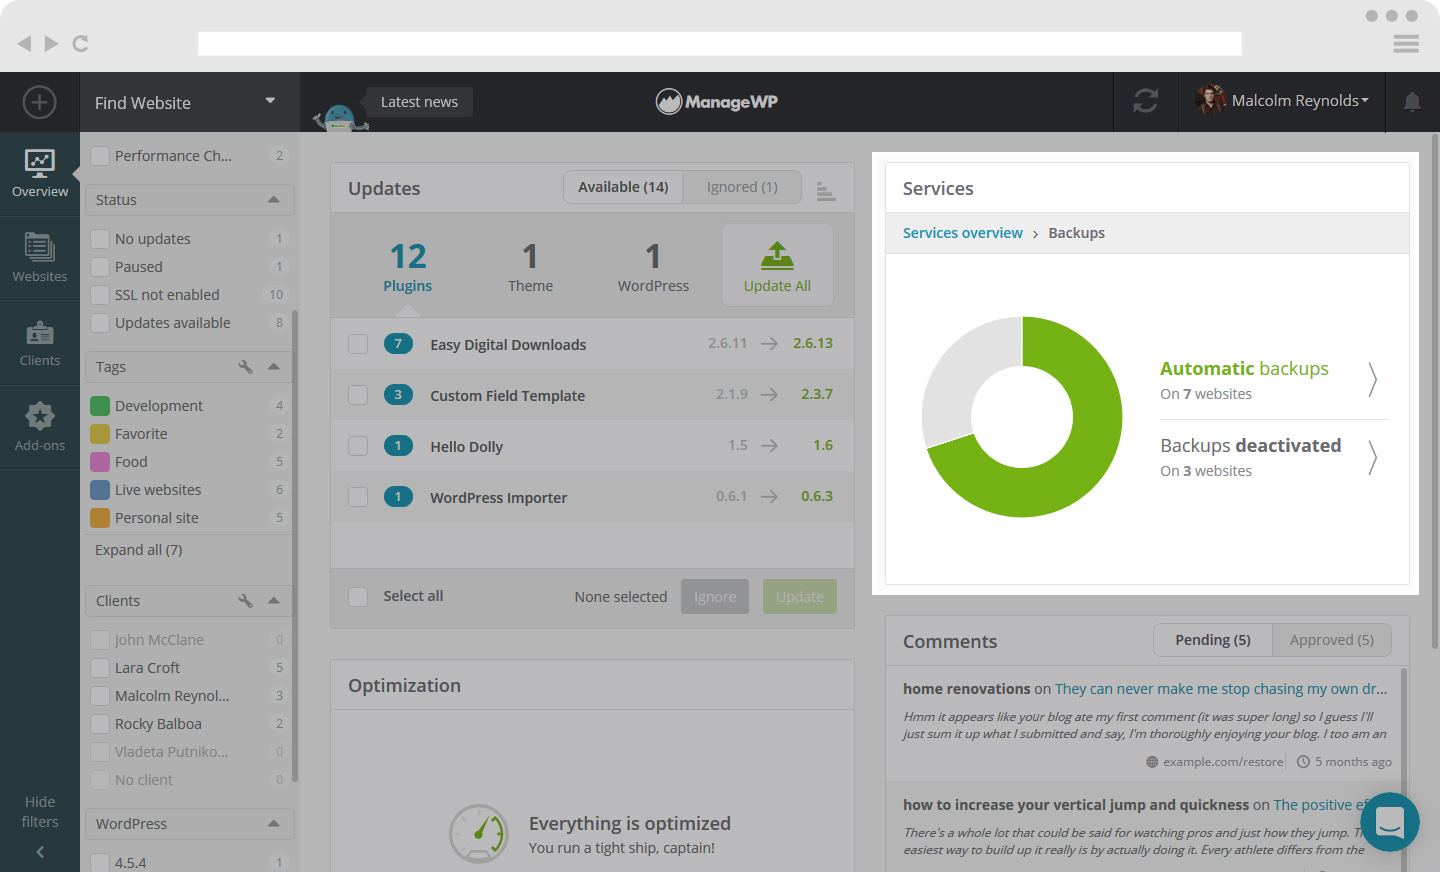
On the overview you can select what Backups you would like to look into. By clicking on Automatic Backups you will get precise details of each Backup. If you have not enabled your backups you will see Backups not enabled, and if there is a problem with your backup, Problems detected. You can click on each of these, to get full details.
Security
When you click on the Security feature you can see how many of your sites are Clean, have Problems Detected or have No Recent Checks.
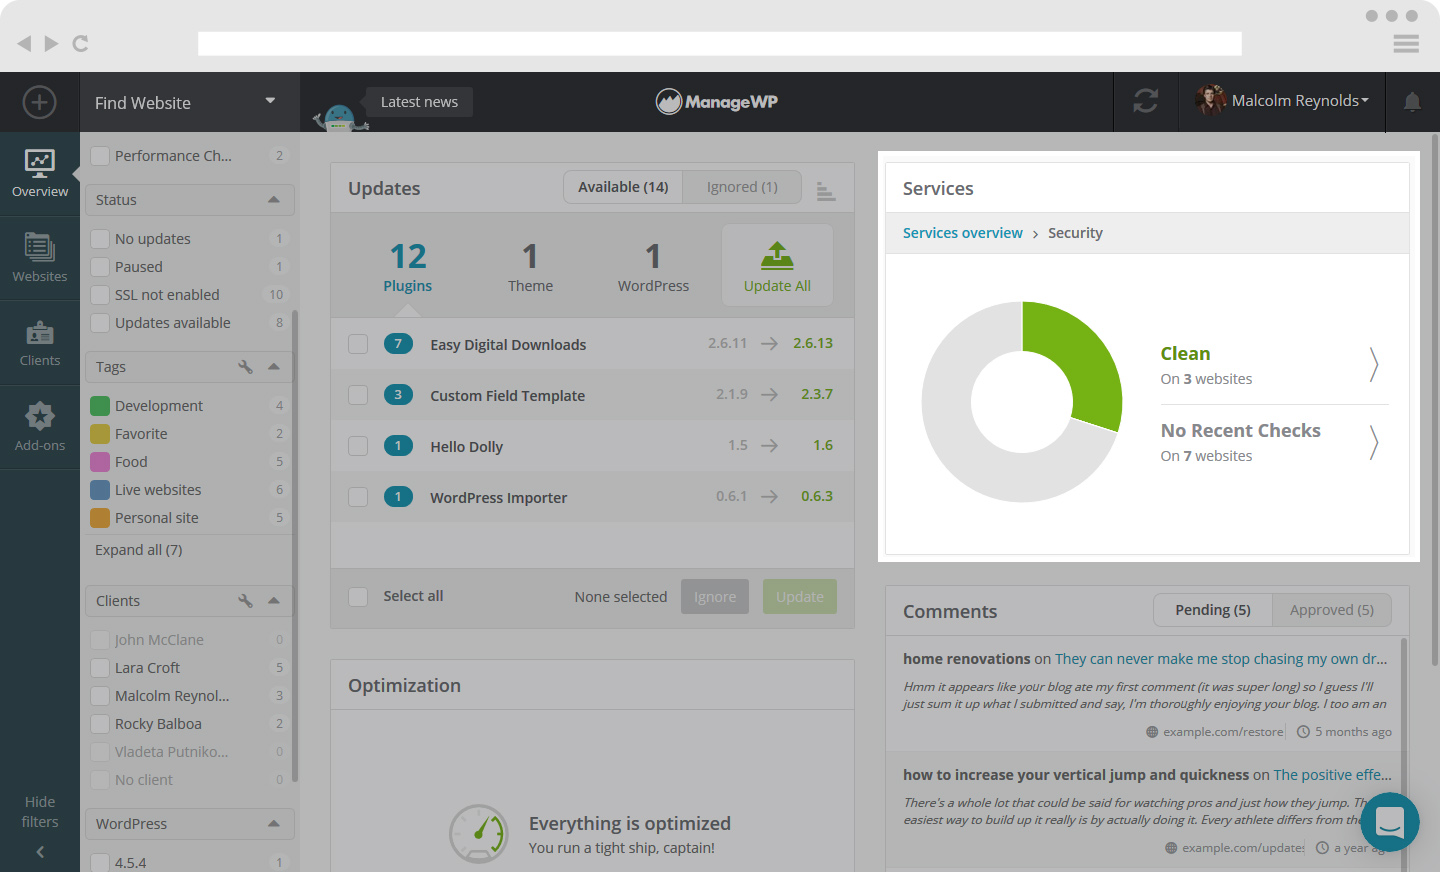
Clicking on each of these will get you full details.
Performance
The Performance feature shows you if your sites are Fast, Standard, Slow or if there are No Recent Checks.
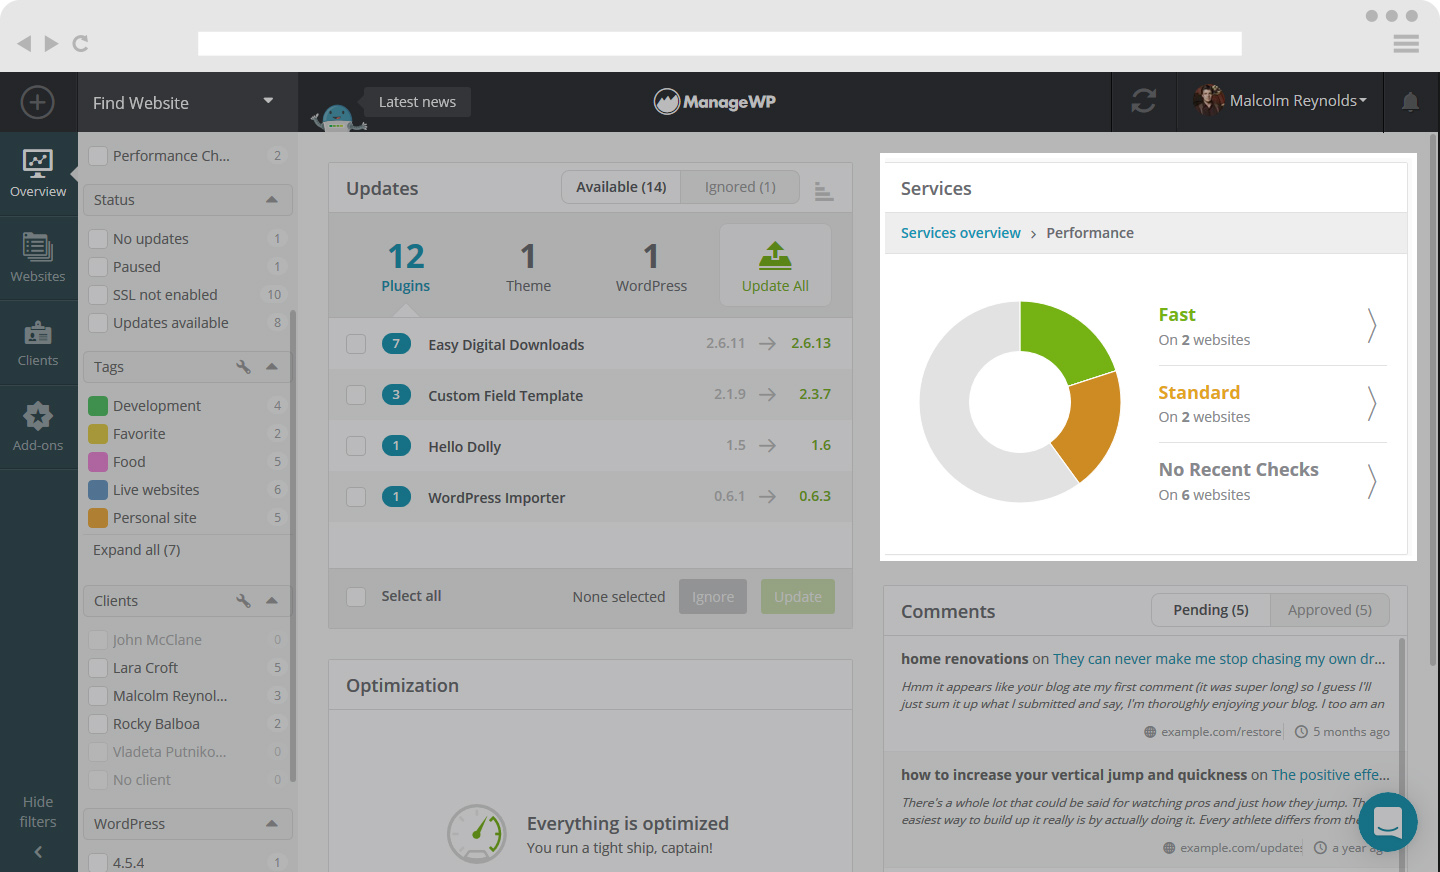
Clicking on each of these will get you full details.
Uptime Monitoring
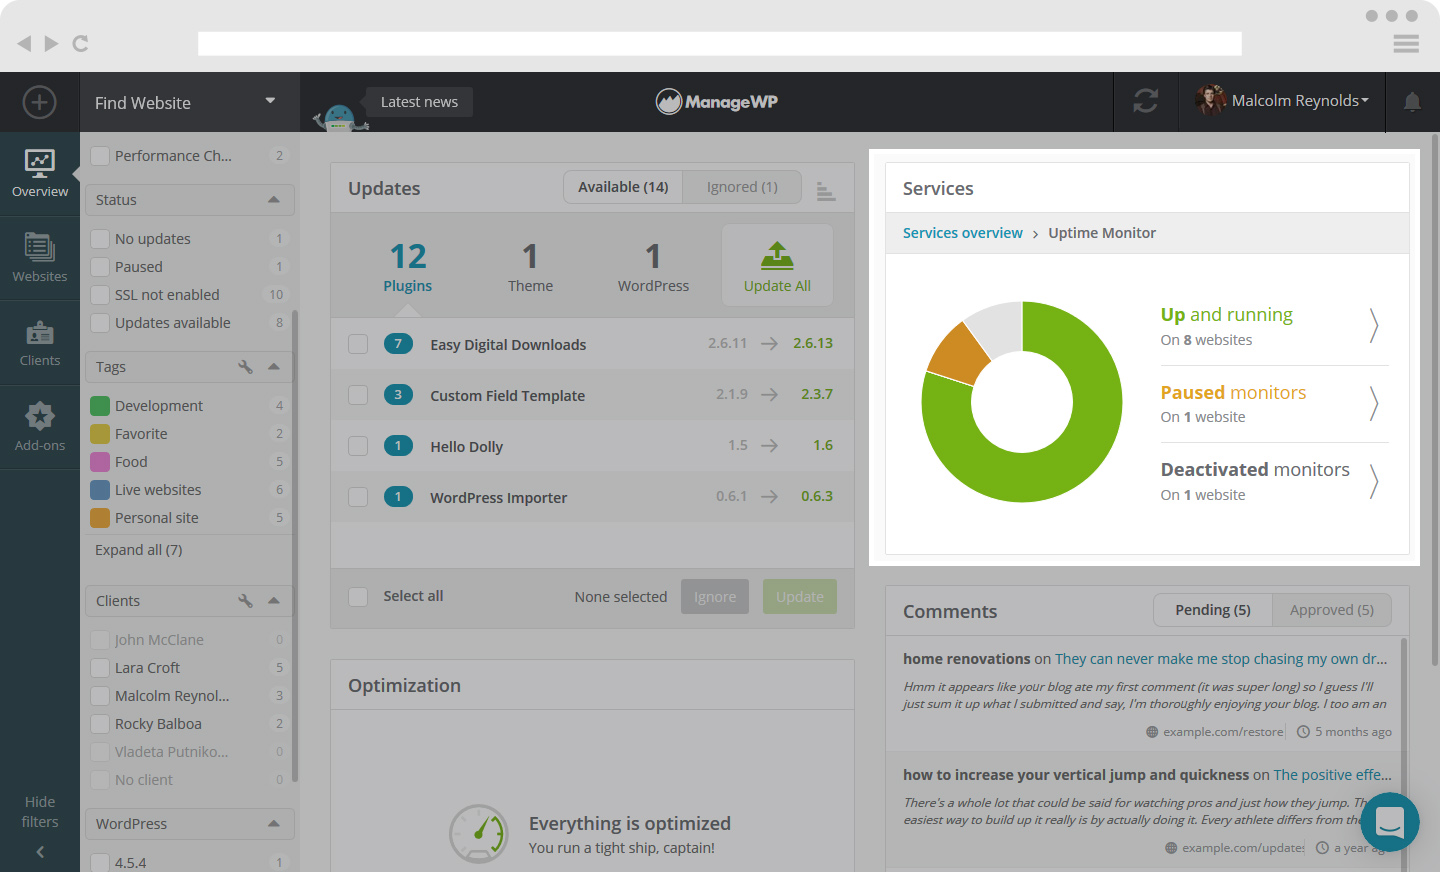
Here is what the display windows look like for the Uptime Feature. You will see an overview, then you have the option of clicking on either Up and running, Paused monitors, Currently down or Deactivated monitors to view your website status in more detail.
SEO
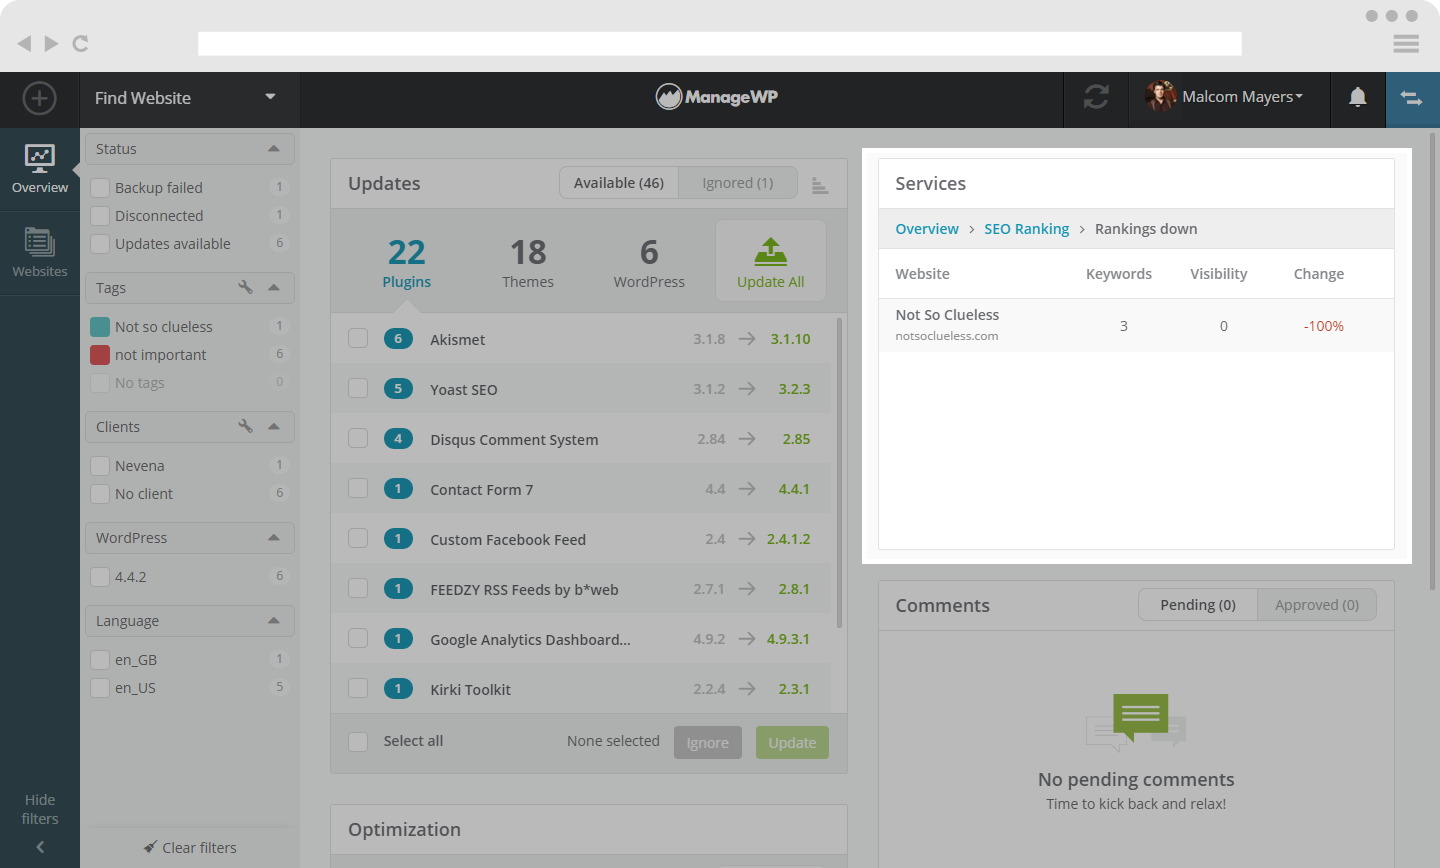
Here is what the display windows looks like for SEO Ranking.
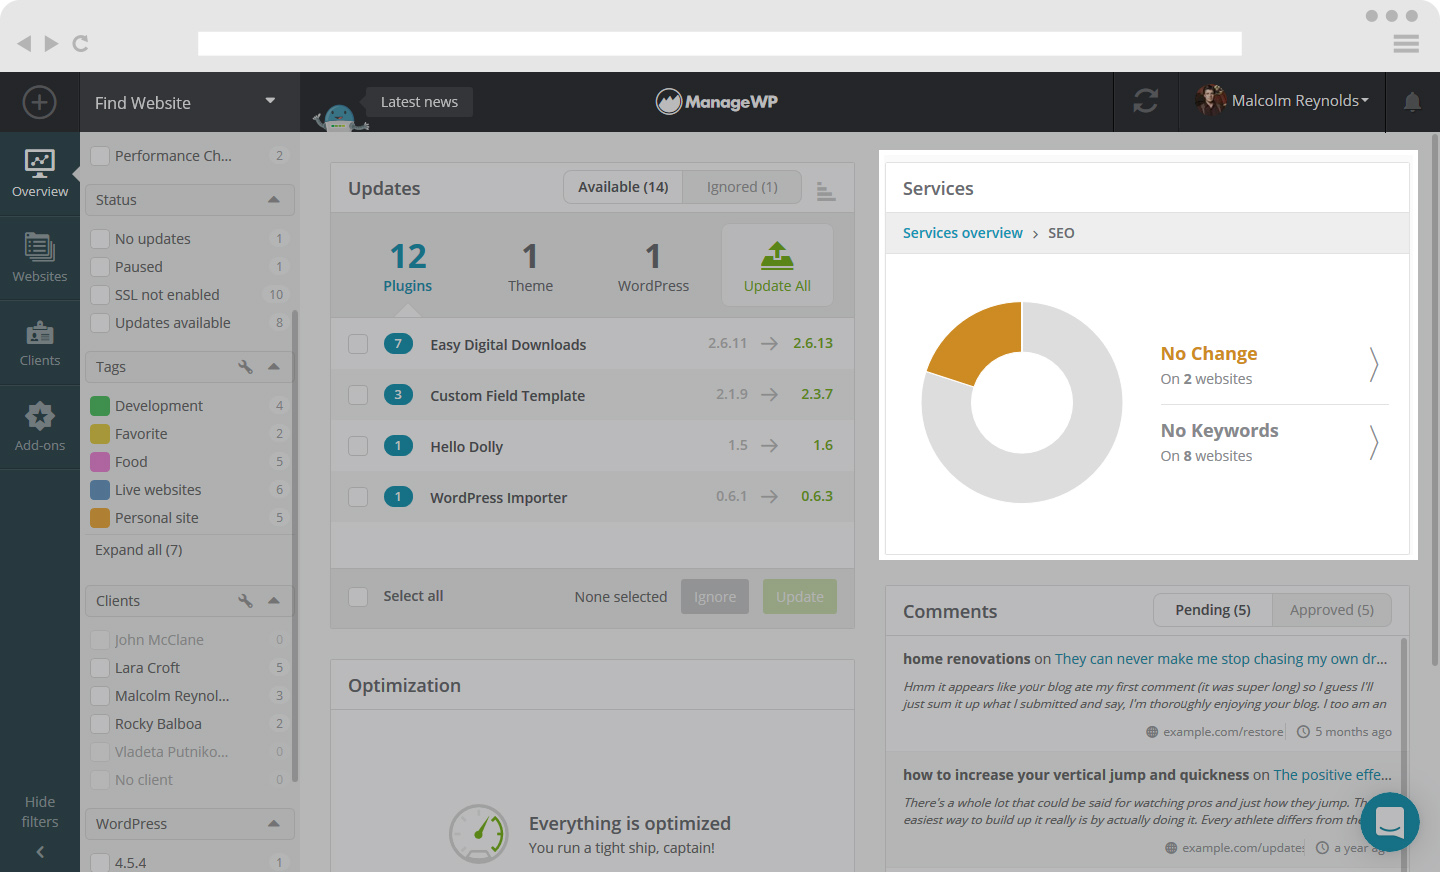
Here you can click on your ranking status, either Rankings up, Rankings down, No Change or No keywords in order to view full details of your rankings.
Analytics
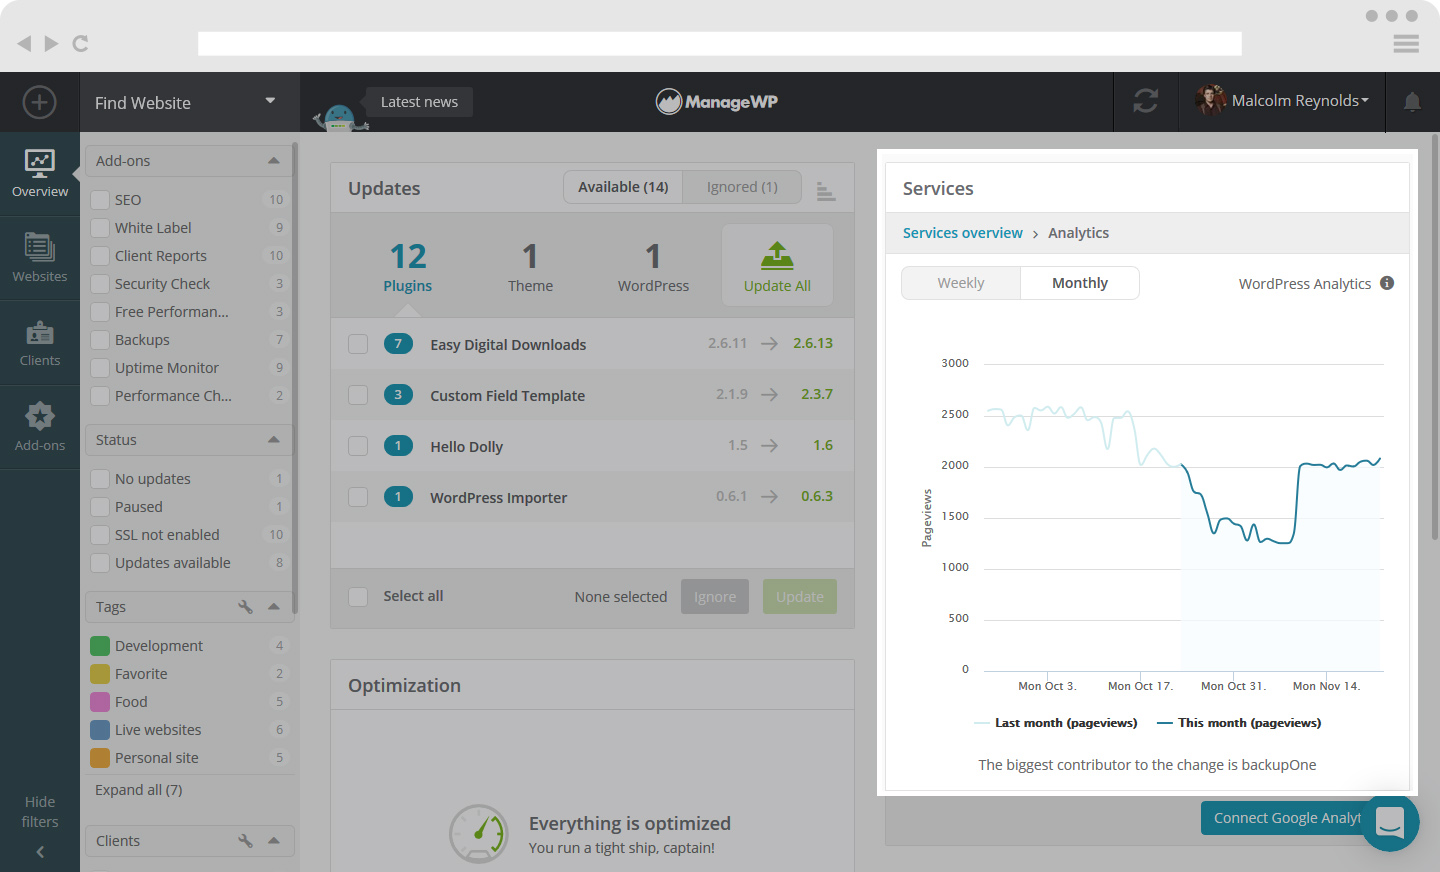
Here is what the display windows look like for the Analytics Feature. You can view your website statistics and choose from the weekly or monthly view.
Comments Widget
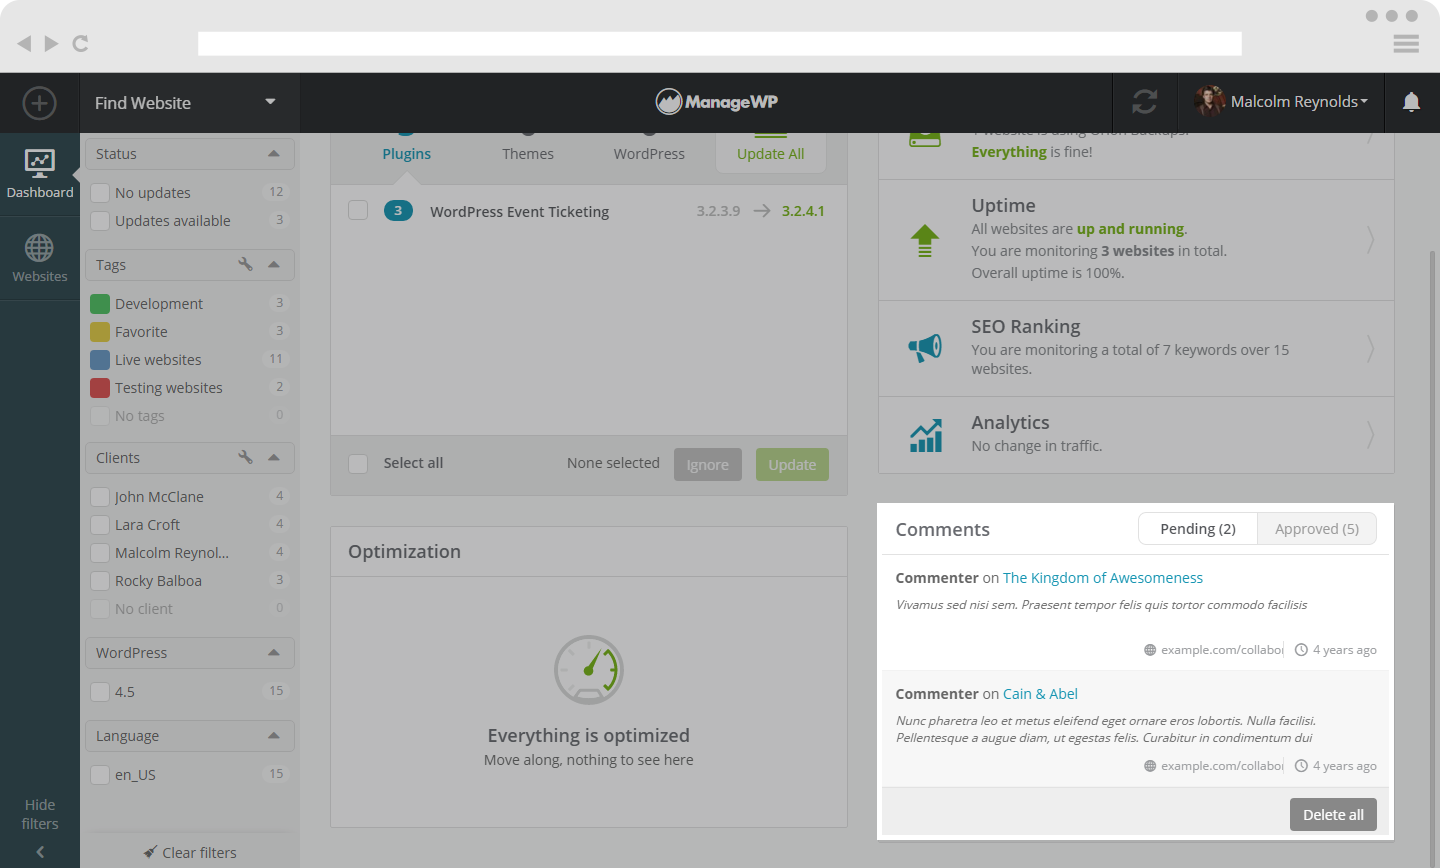
The Comments Widget allows you to see all of the recent comments on your websites. You can directly edit, trash, mark as spam and either approve or disapprove them. You can also delete all pending comments.
Get to know your Website Tab
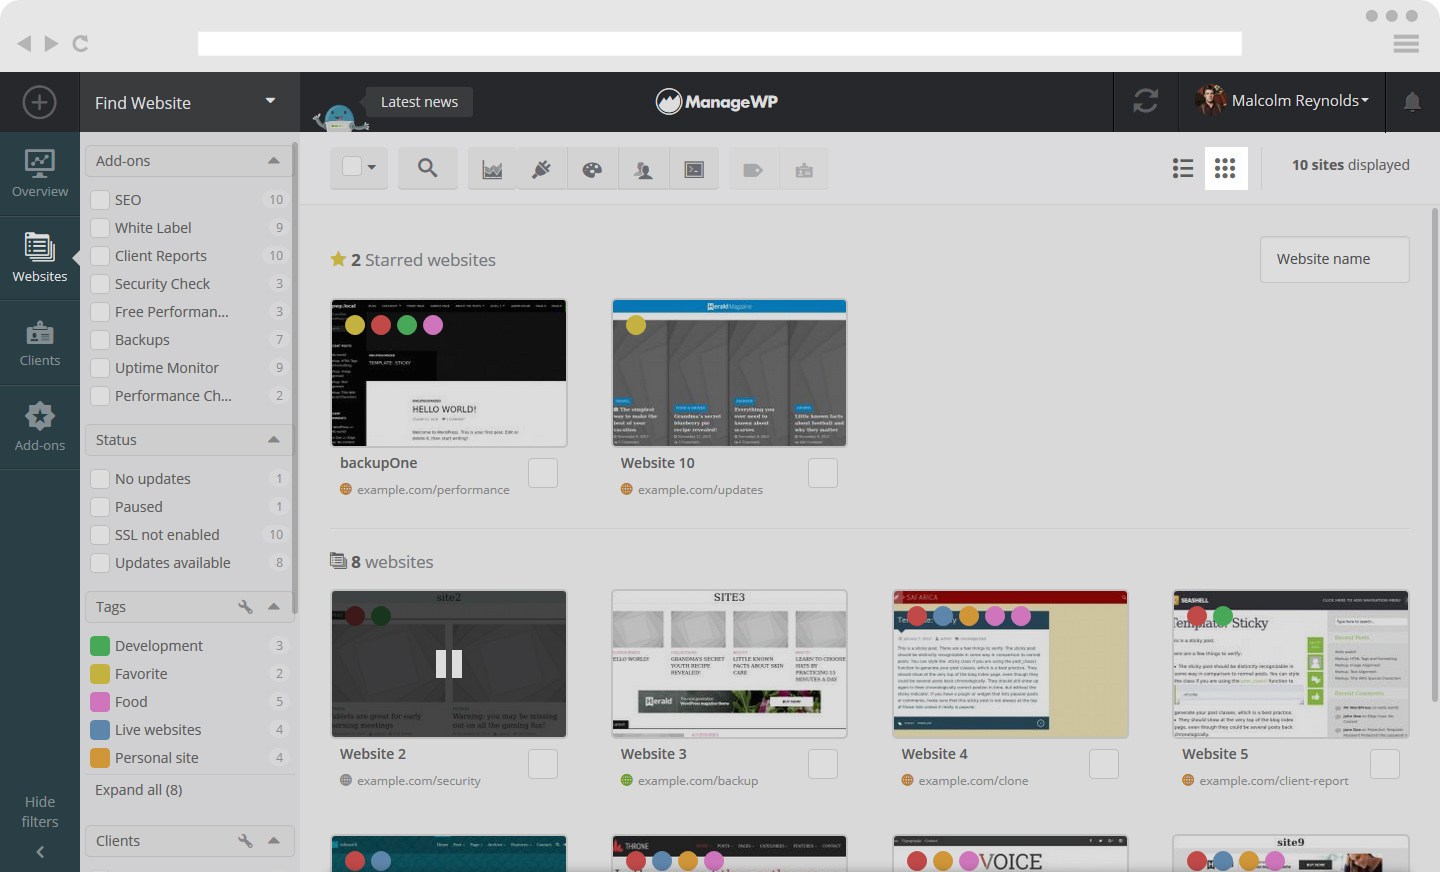
There are two ways you can setup your Website view. You can view it in Thumbnail format or in List format. You can switch between by clicking on the top right corner on the menu bar, under your Login Details.
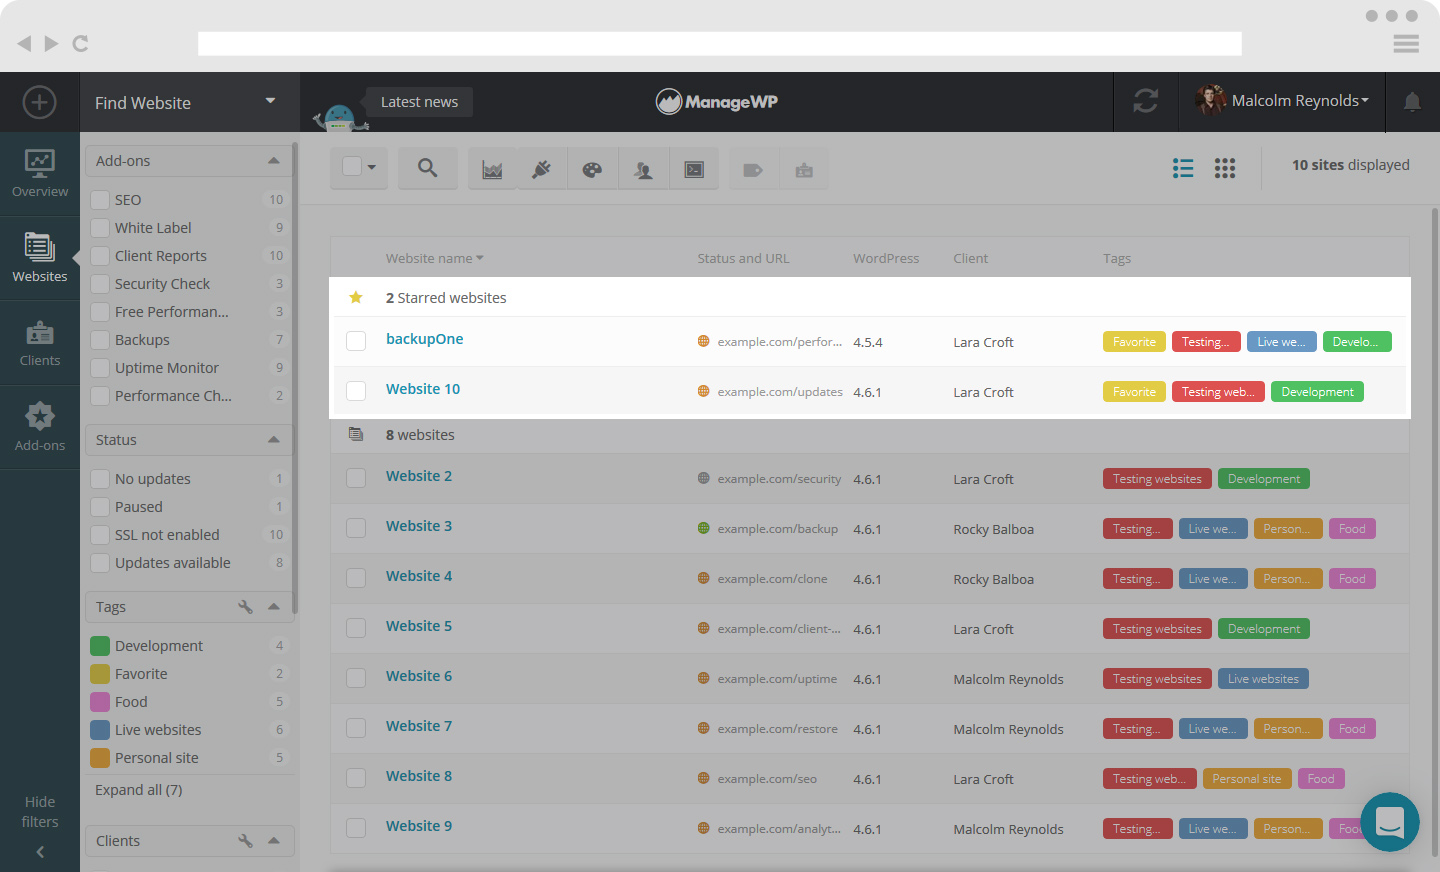
This is your Website View in List format.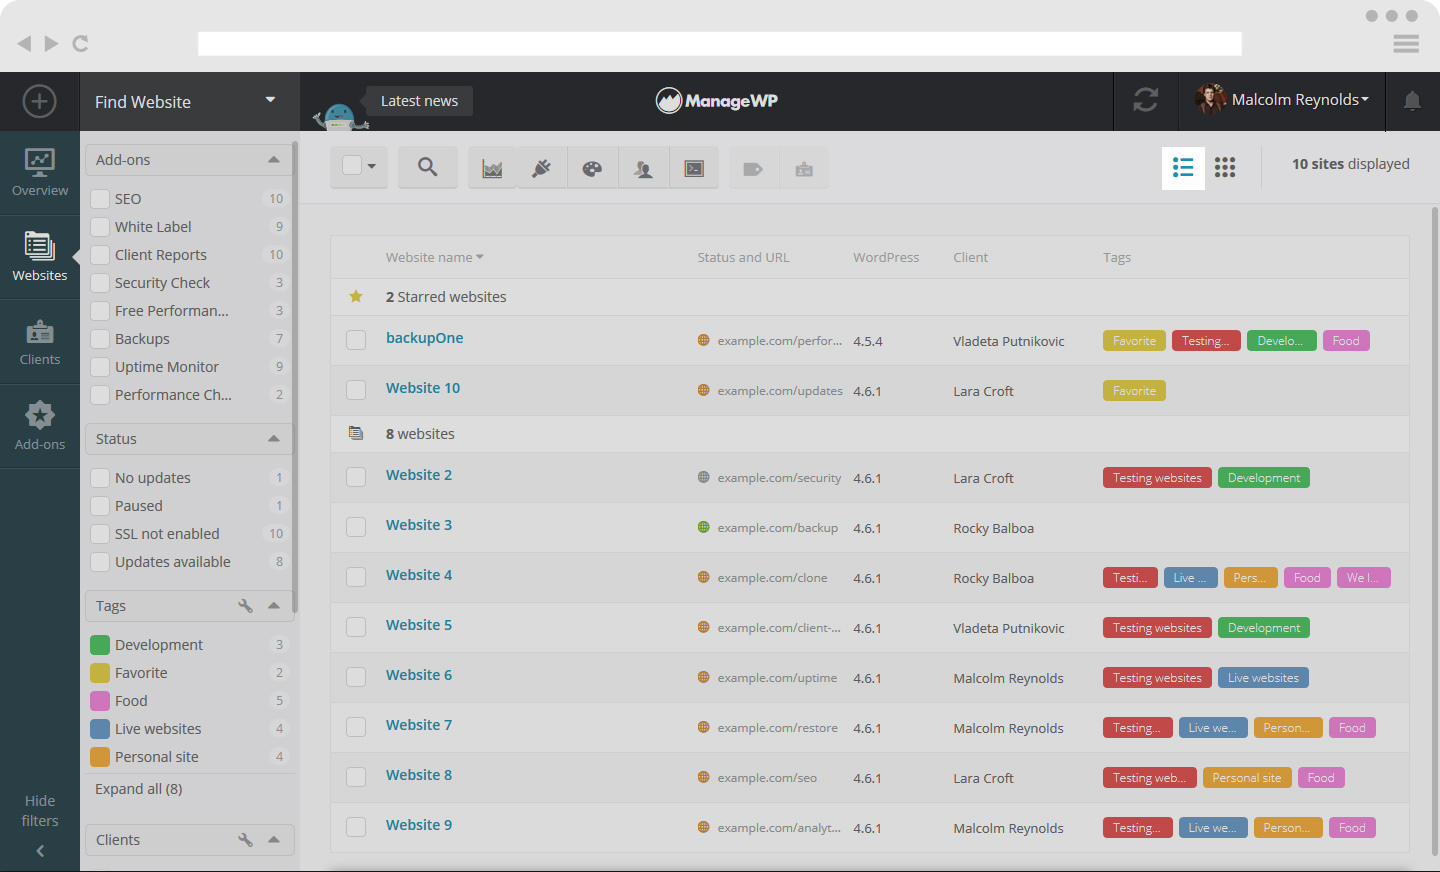
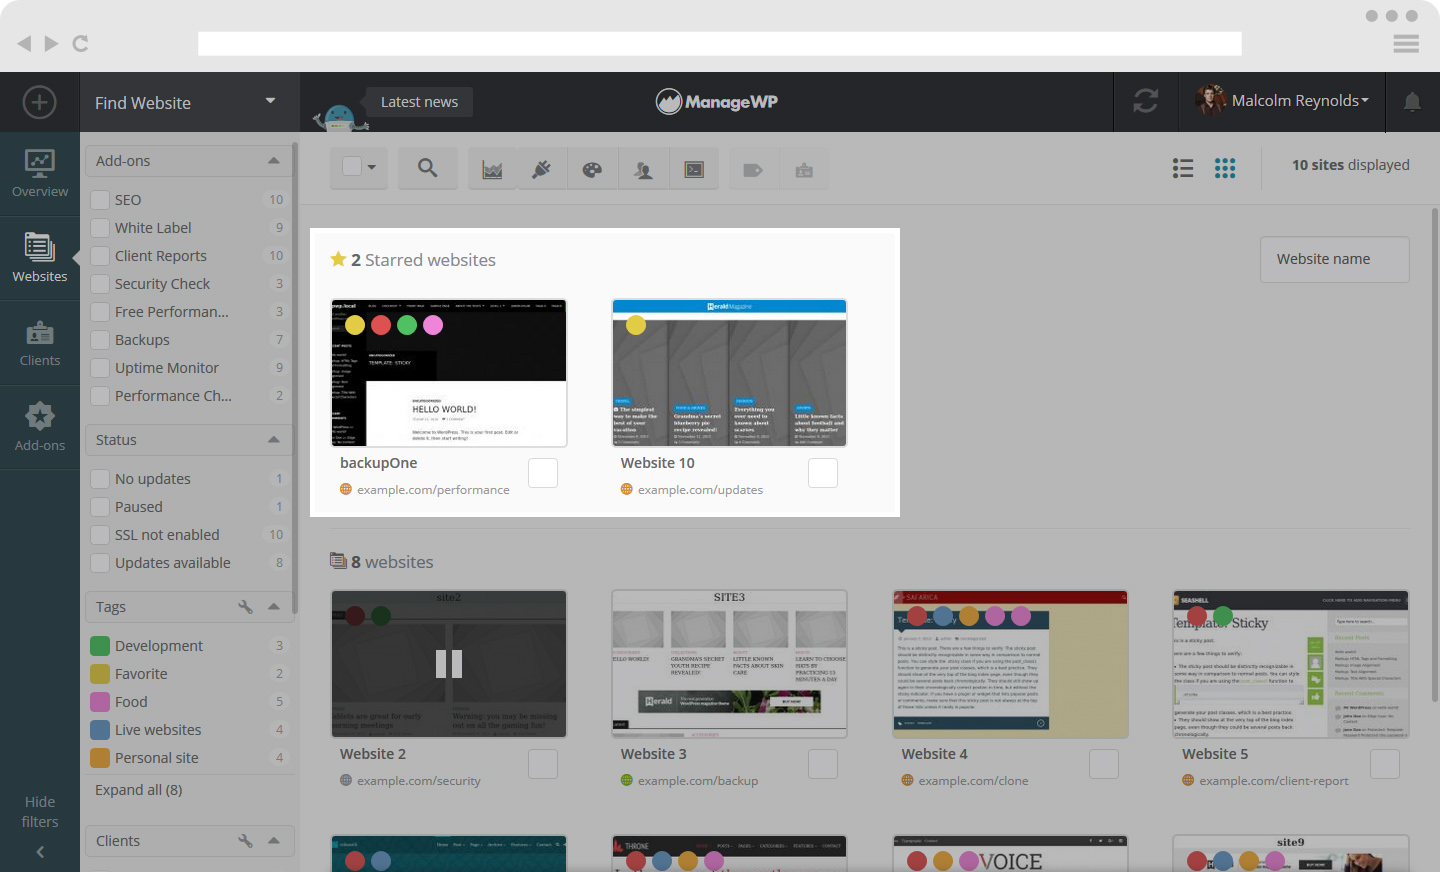
This is your Website View in Thumbnail format.
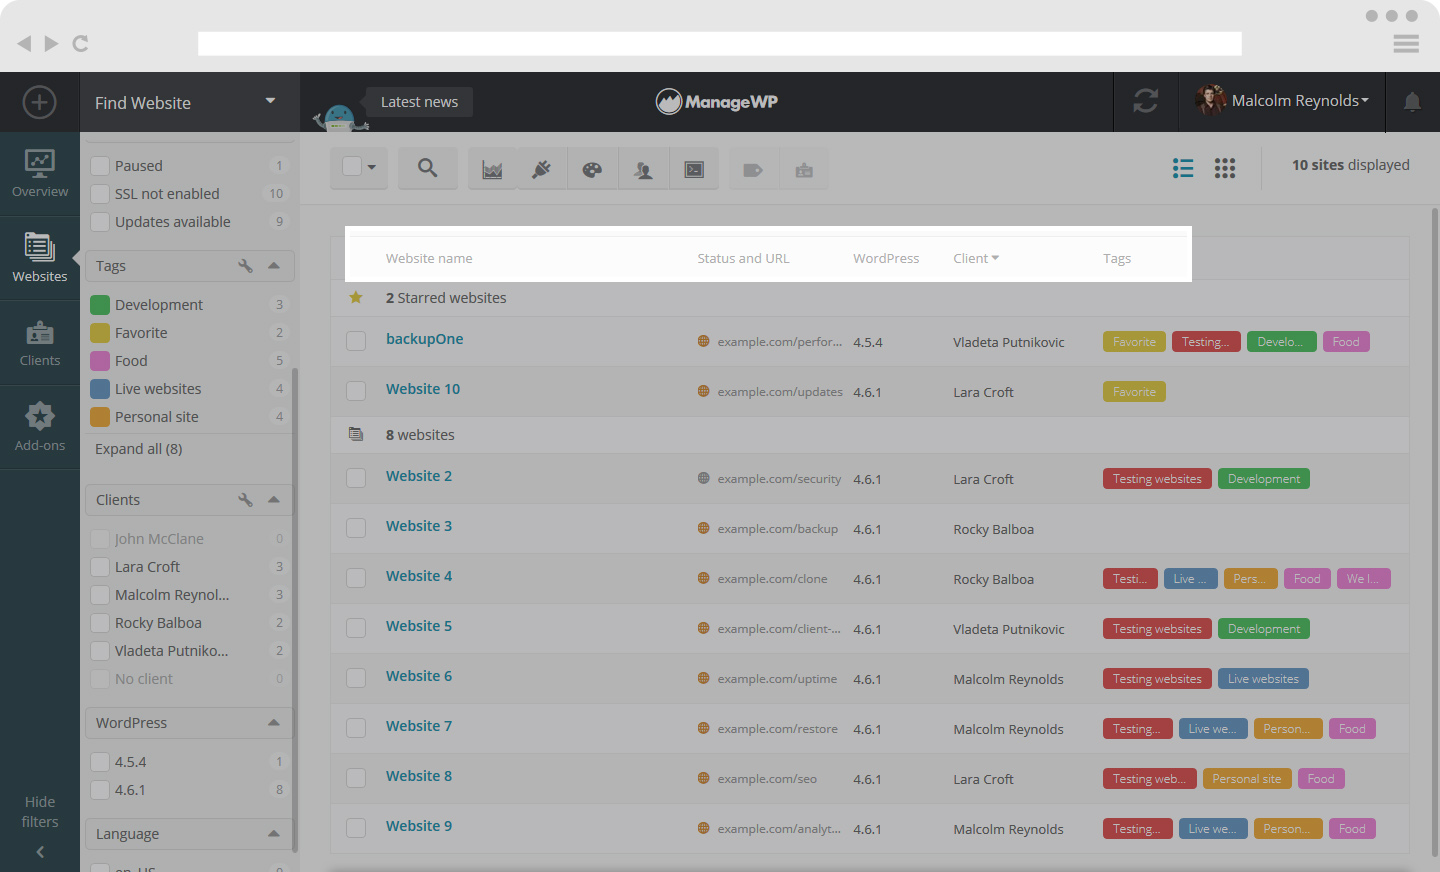
You can filter your websites in List format by Websites name, Status and URL, WordPress version, Clients and Tags.
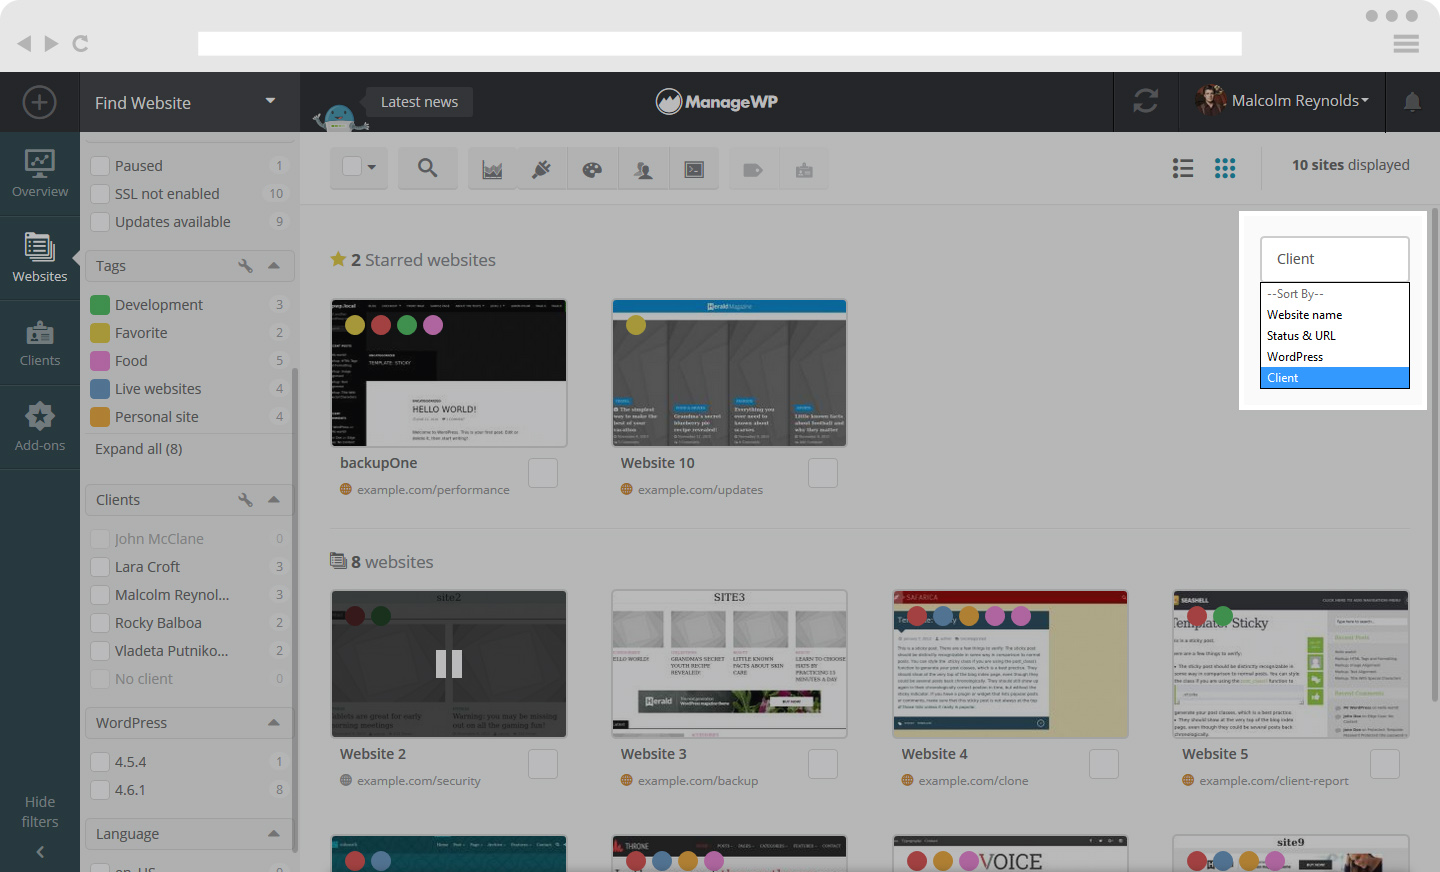
Here are filter option to sort by your sites for Thumbnail view.
How to star favorite websites in your dashboard
ManageWP now gives you the option to “star” certain websites. These websites will the displayed at the top of your screen, collected separately. Underneath you will see the remaining Websites you are managing.
Hovering over an individual website
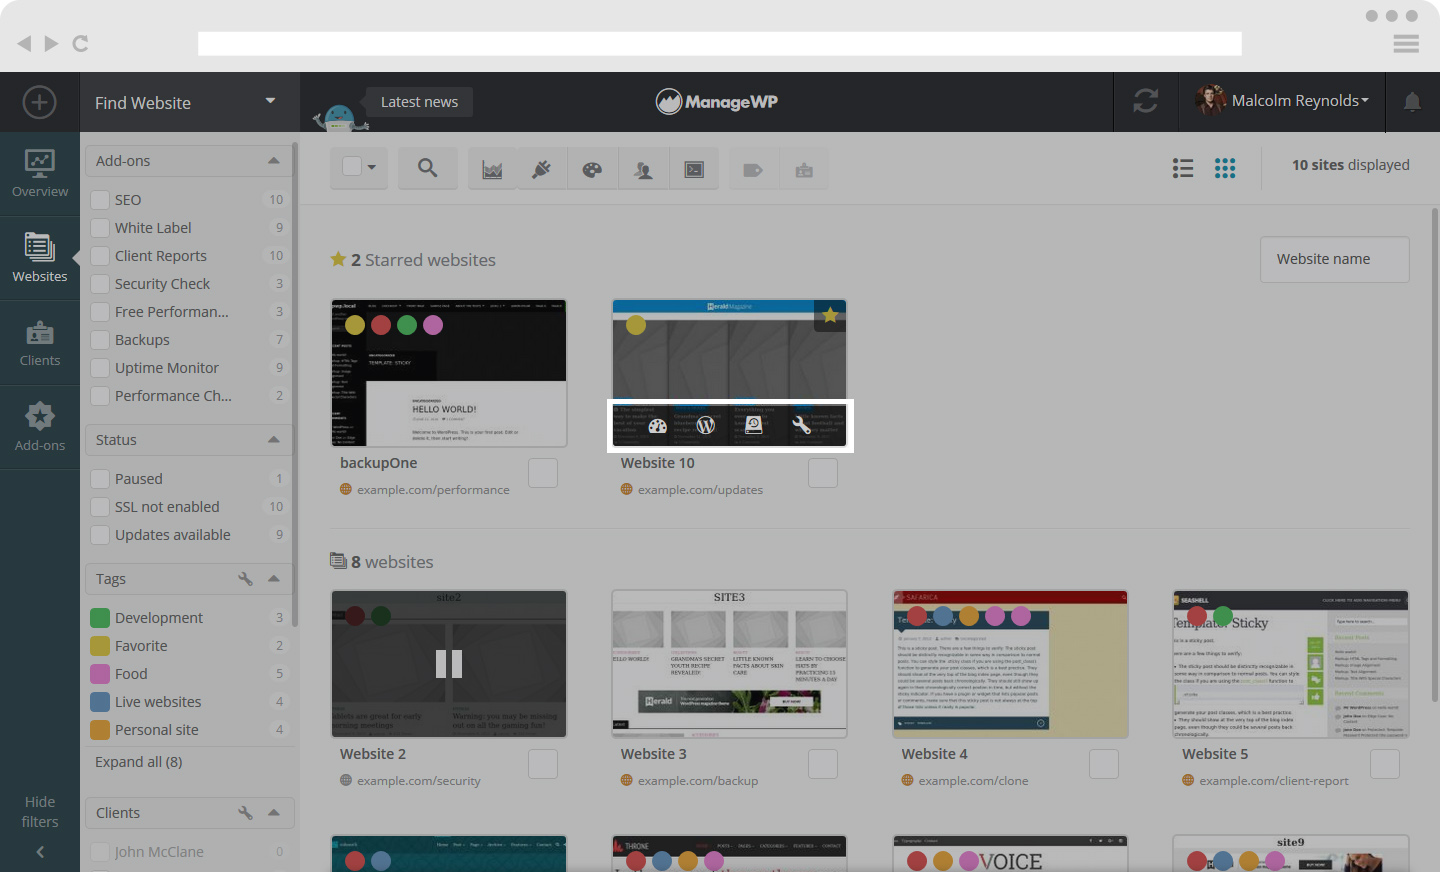
When you hover over an individual website on your dashboard, you will see a set of options appear.
This is what it looks like in Thumbnail format.
This is what it looks like in List format.
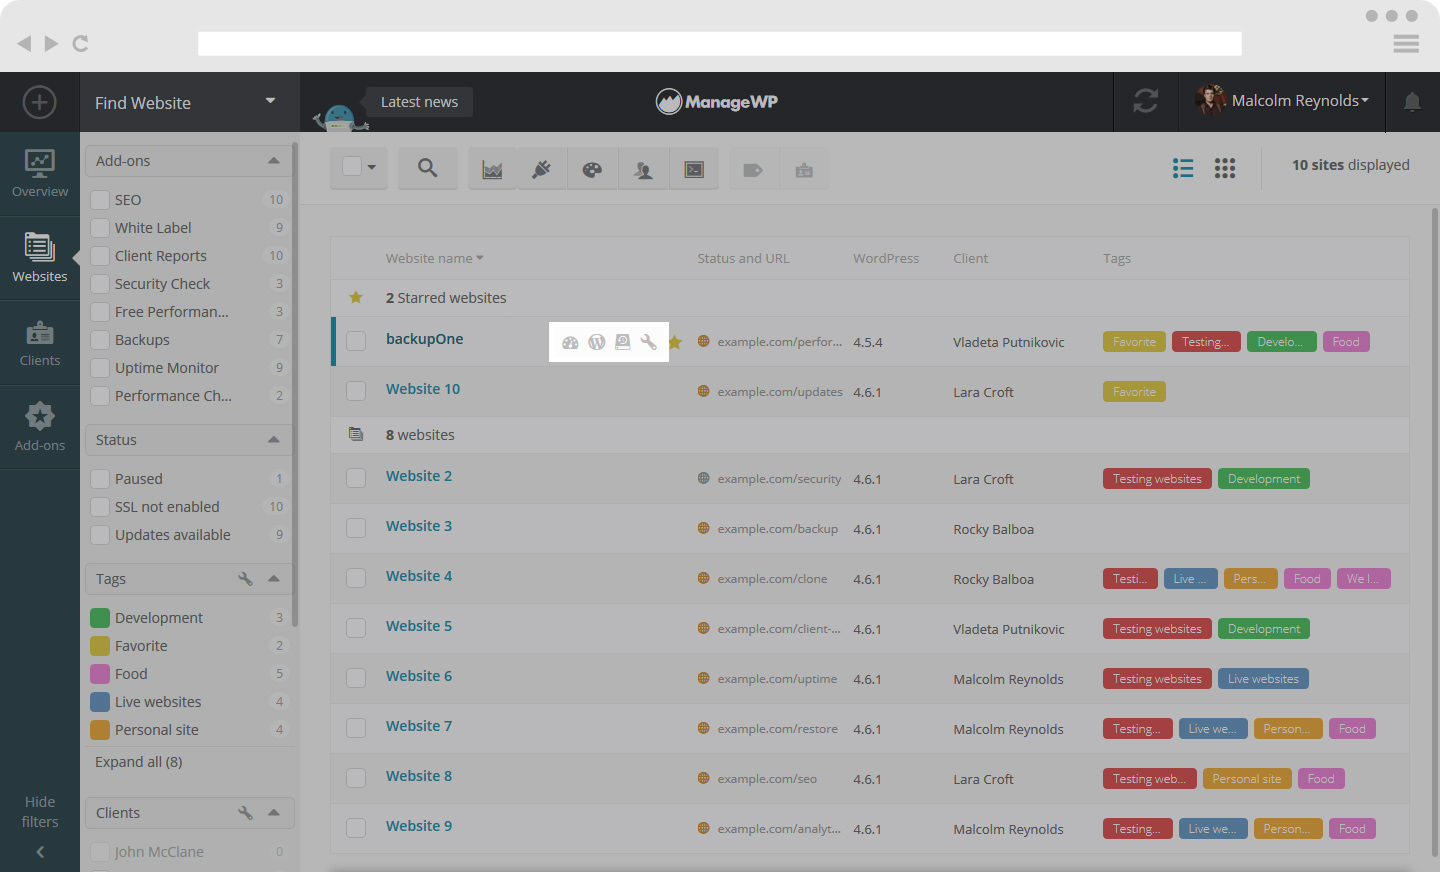
The icons you see are the following:
- Open Website Dashboard
- Open WP Dashboard
- View Backups
- Site Options
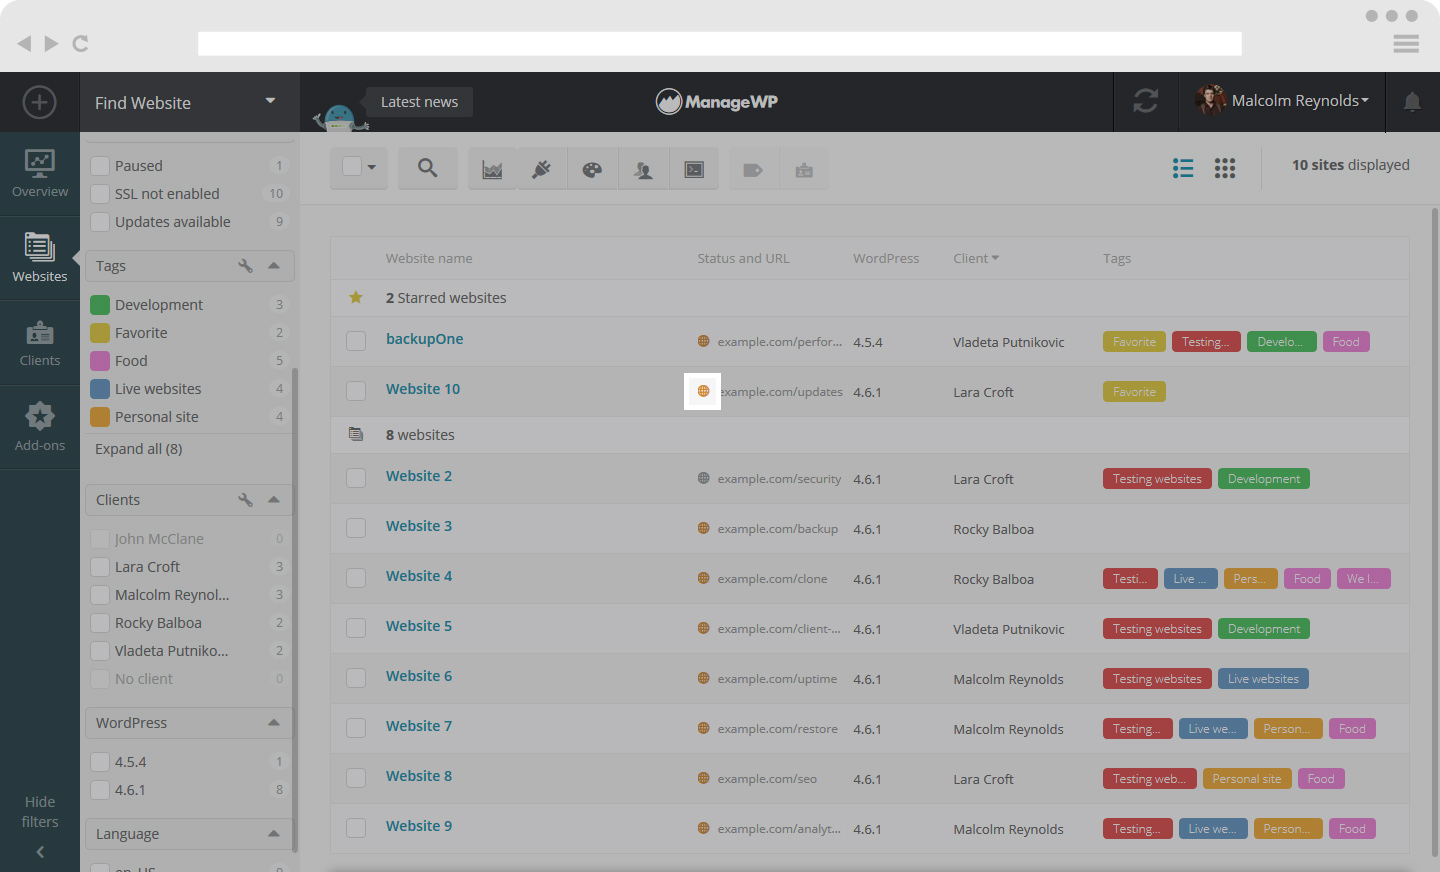
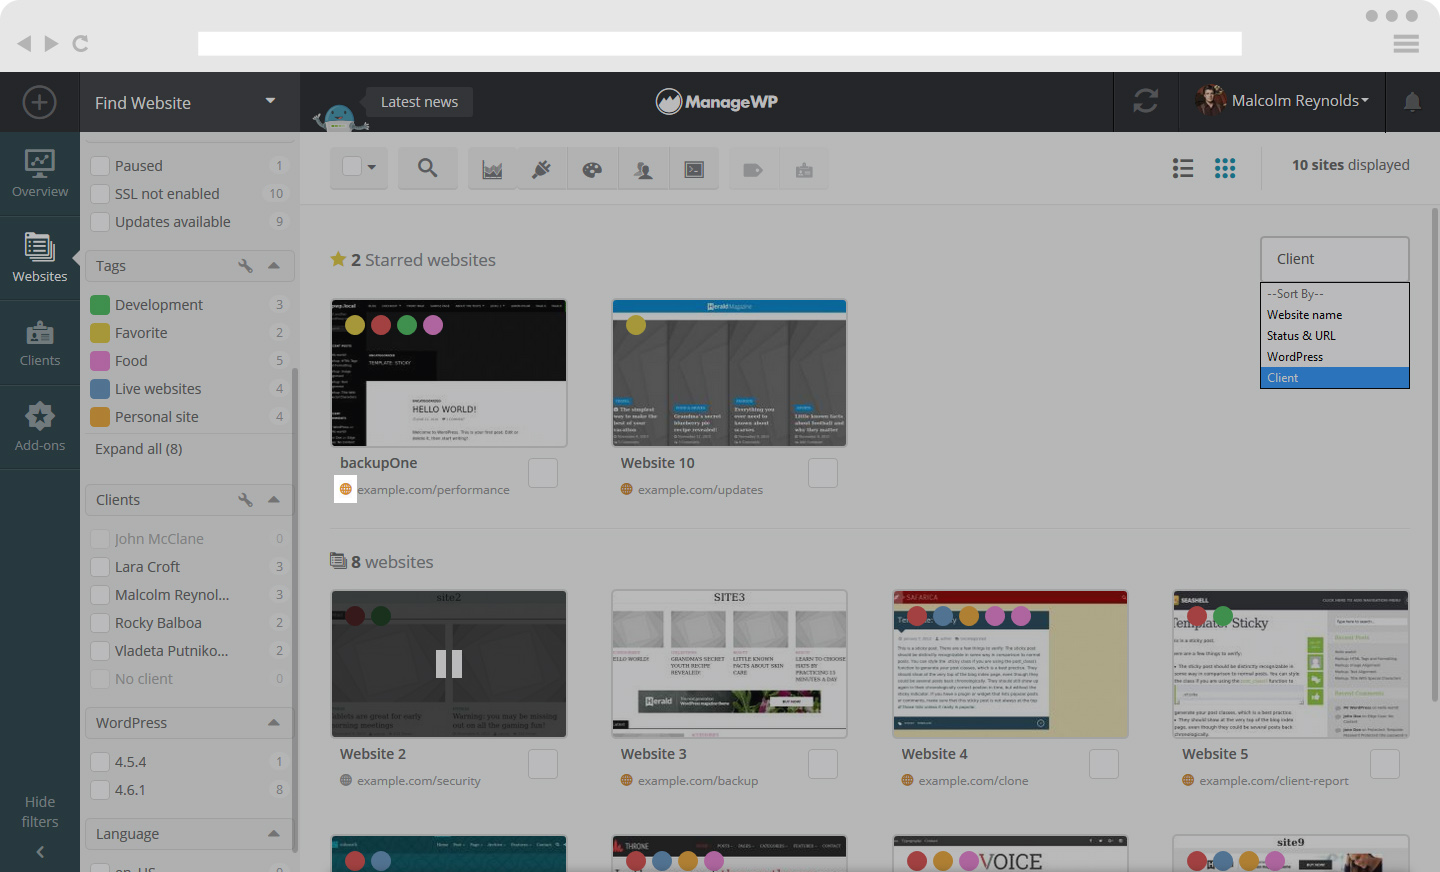
Beside each website, there is a Status Icon indicating the status of your website and it appears as the world symbol.
- Green – No updates available
- Orange – Updates available
- Red – Disconnected website
- Grey – Paused/Not synced website
Status Icon in Website view – List format
Status Icon in Website view – Thumbnail format
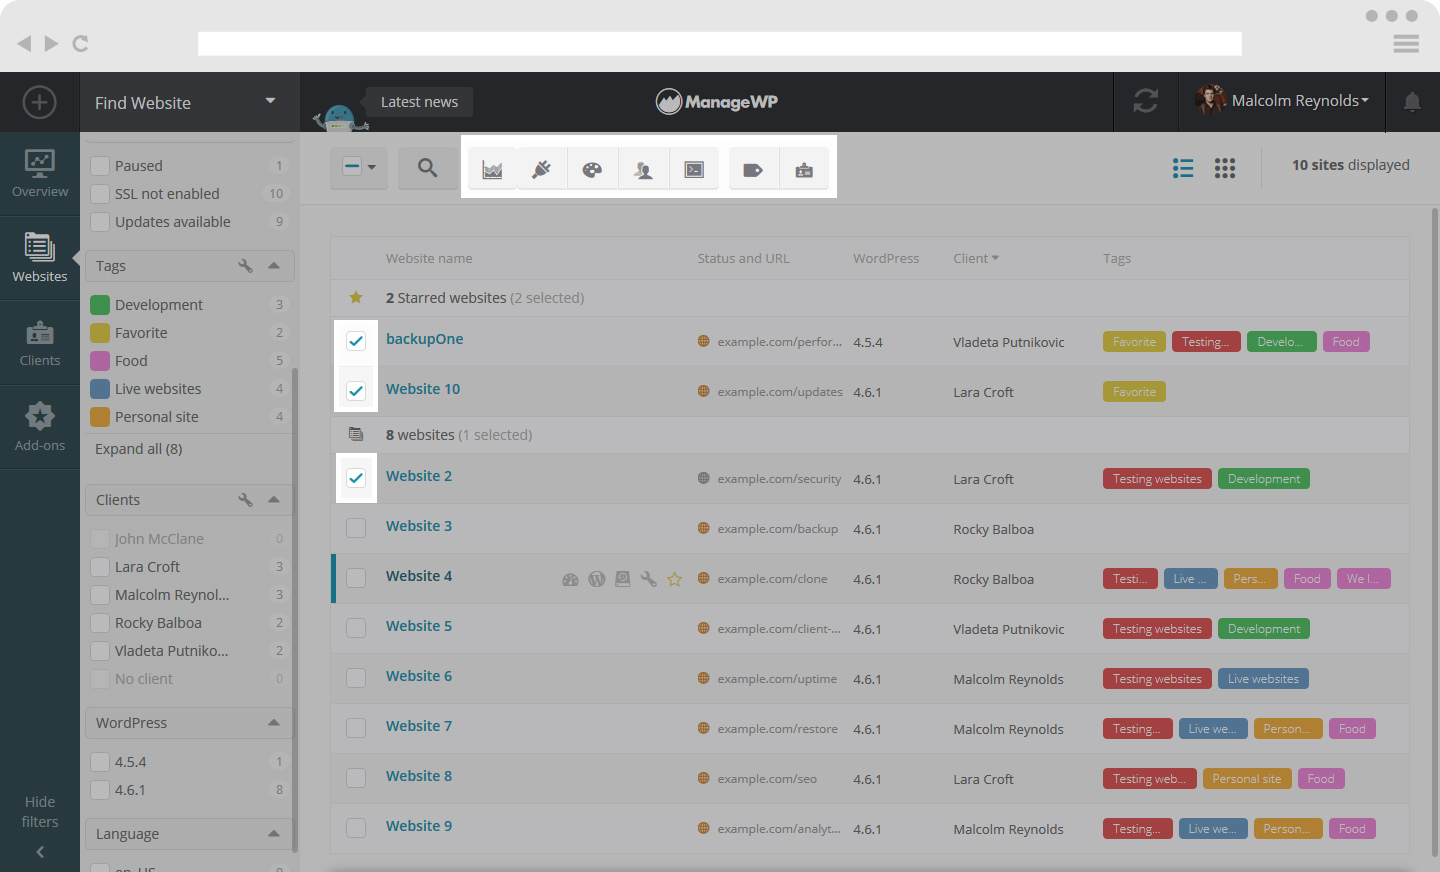
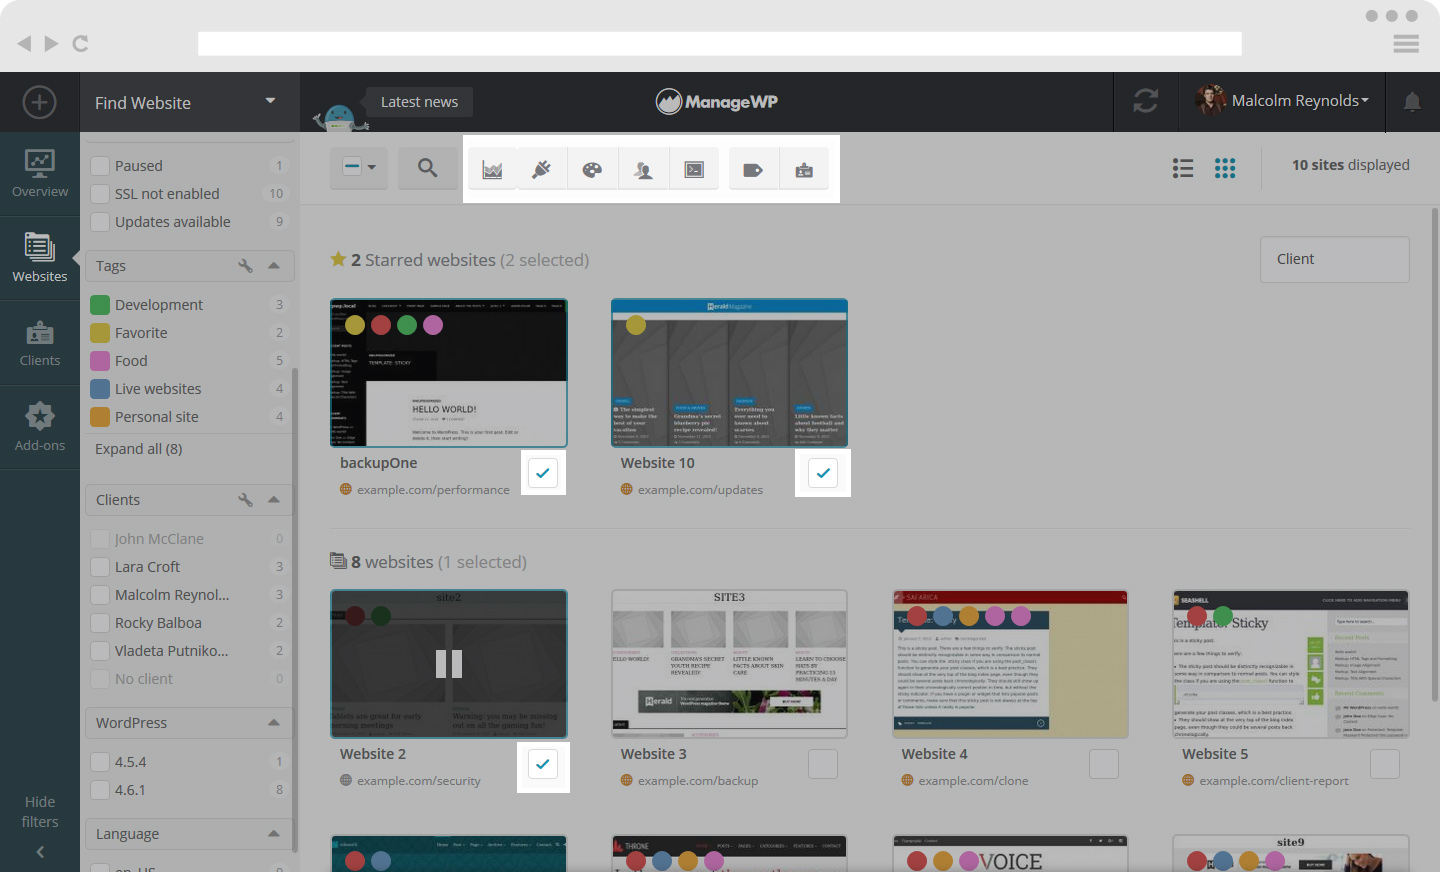
Selecting more than one website in website view in list and thumbnail format
When you select one or more website a set of options appears on the top menu bar. This allows you to perform actions on more than one website simultaneously. Here you can:
- Create Client Report
- Manage Plugins
- Manage Themes
- Manage Users
- Assign Tags
- Assign Clients
Selecting more than one website in Website View – List Format
Selecting more than one website in Website View – Thumbnail Format
Get to know your clients tab
Clients tab gives you the option to organize your clients.
Get to know your add-ons tab
Add-ons tab shows list of sites with the view of which of the premium add-ons is activated.
 Yes
Yes
 No
No
