Whenever you’re working with code, you’re bound to run into some issues. As a developer, some errors can be easier to spot, like syntax or runtime errors. These are still frustrating as they can make your application seem unreliable. However, other errors, like logic errors, can be more difficult to identify.
Fortunately, debugging in WordPress is a quick and simple way of finding and fixing bugs in your code. As a result, you can improve performance and provide a safe, smooth experience for your users.
In this post, we’ll take a closer look at what debugging in WordPress involves. Then, we’ll guide you through two easy ways to troubleshoot errors in your code and explore some useful tools for debugging in WordPress. Let’s get started!
An introduction to debugging in WordPress
Whenever you add custom code like PHP and JavaScript, errors can appear in your themes, plugins, and even on your server. Debugging is an excellent way to identify and resolve these issues quickly. This process enables you to find the source of your errors and learn more about them, which can help prevent future issues.
Of course, you can always deactivate each of your plugins one by one or consider switching themes to fix errors. However, this can be time-consuming. Plus, some errors are only visible in the debug log. As such, you wouldn’t even know there was a problem with your website on the surface.
It can be useful to debug in WordPress before taking your projects live. This enables you to test out your code first before making it accessible to users. That way, you’re less likely to bump into any nasty surprises along the way.
A quick guide to debugging in WordPress (2 methods)
Before you start, we’d recommend creating a staging environment. This prevents errors from becoming visible on your front end and disturbing your visitors. Now, let’s take a look at two quick ways to debug in WordPress.
1. Enable debugging using a plugin
This is the simpler of the two methods, as it doesn’t require accessing and editing your site files. Instead, you can use a plugin to handle the process for you. Therefore, if you’re not especially tech-minded, this will be the best option for you.
To begin, install a plugin within WordPress like WP Debugging:
Once the plugin is activated, head to Tools > WP Debugging. Make sure the box beside “Set WP_DEBUG to true” is checked. Then, click on Save Changes:
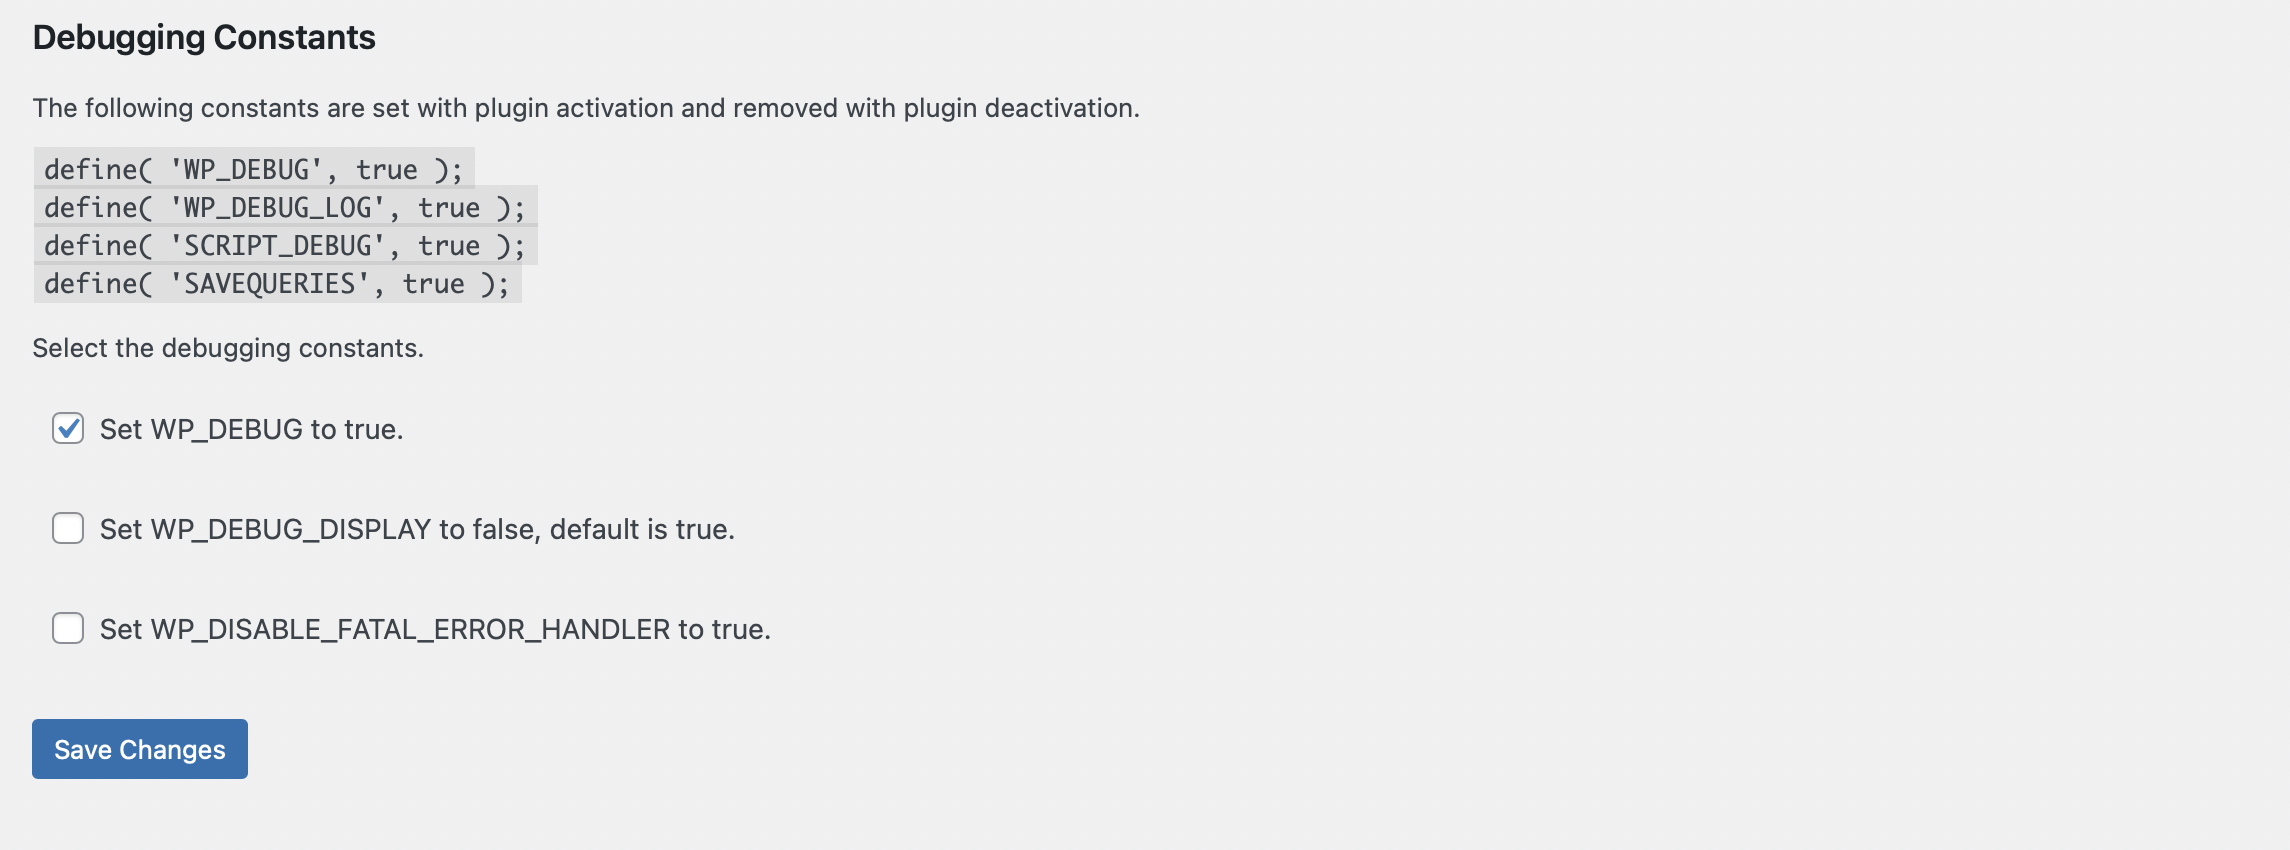
At this point, debug mode is enabled on your WordPress website. However, when you’re done, remember to disable debug mode by unticking the box.
2. Enable debugging manually
You can enable debugging in WordPress manually if you feel comfortable tinkering with your site files. For complete beginners, you might be better off using the first method in this guide. However, this is the one to use if you get locked out of your site and served the White Screen of Death.
The debug feature is built into WordPress. However, you’ll need to edit your wp-config.php file to activate it. Before you start, it’s important to back up your website and make a copy of the file in case you encounter problems.
Now, navigate to the root directory of your website. You can do this by logging into your hosting account, accessing the control panel, and locating your File Manager. Or, you can use an FTP Client like FileZilla.
Whichever way you choose, you’ll need to locate your public_html folder. Open the folder and find the wp-config.php file:

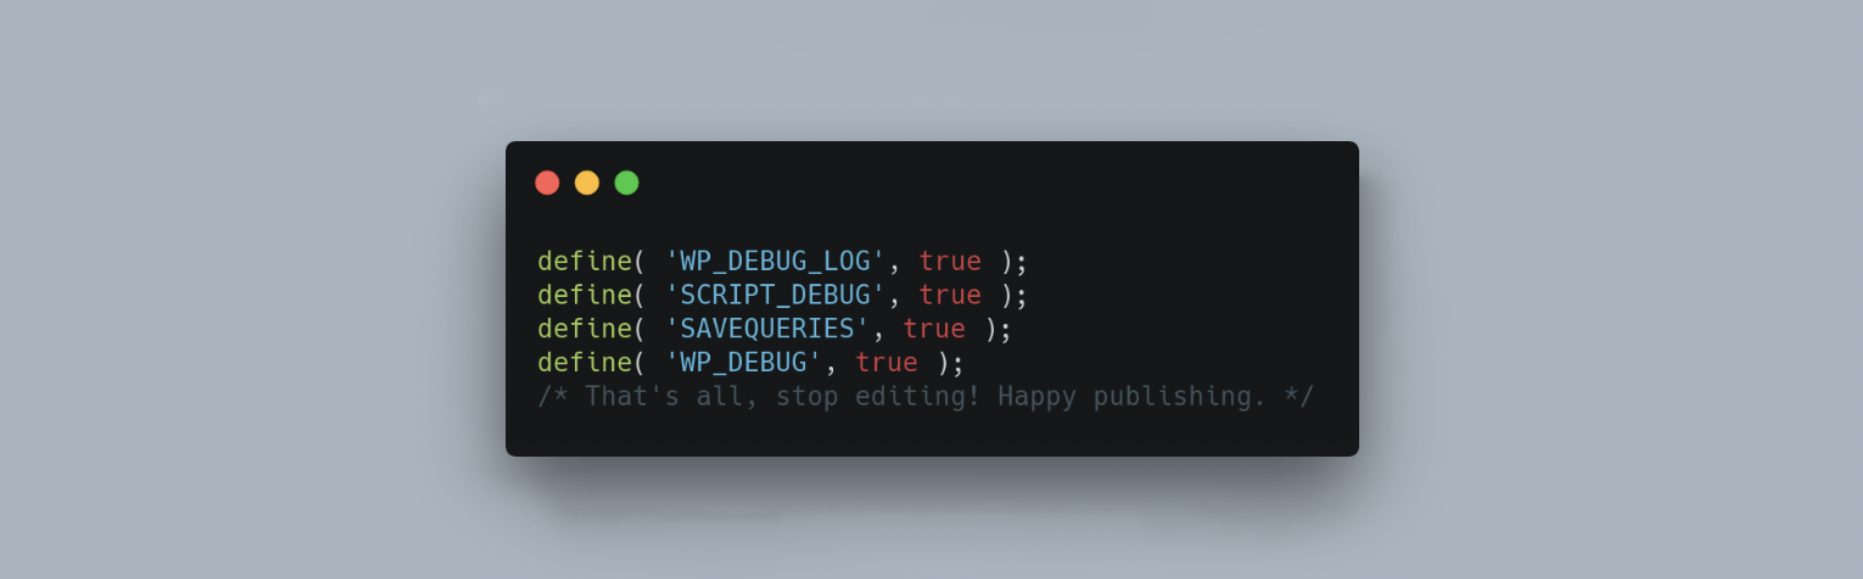
Right-click on the file to download a version of it to your computer. Next, open the file and scroll down until you see: That’s all, stop editing! Happy publishing:

Before this line, you need to add your code:
- Define ( ‘WP_DEBUG’, true );
- Define ( ‘WP_DEBUG_DISPLAY’, false );
- Define ( ‘WP_DEBUG_LOG’, true );
It’s a good idea to leave DISPLAY set to false to avoid causing errors on your live website. At this point, be sure to save your changes and disable debug mode. To do this, follow the same steps above and either completely remove the code or change the values to false.
4 useful tools for debugging in WordPress
Now that you know how to debug in WordPress, let’s take a look at some additional tools that can help.
1. Query Monitor
Query Monitor is a powerful plugin that provides a developer tool panel on WordPress. As a result, you can enable database queries, PHP code errors, HTTP API calls, and stop editor blocks:
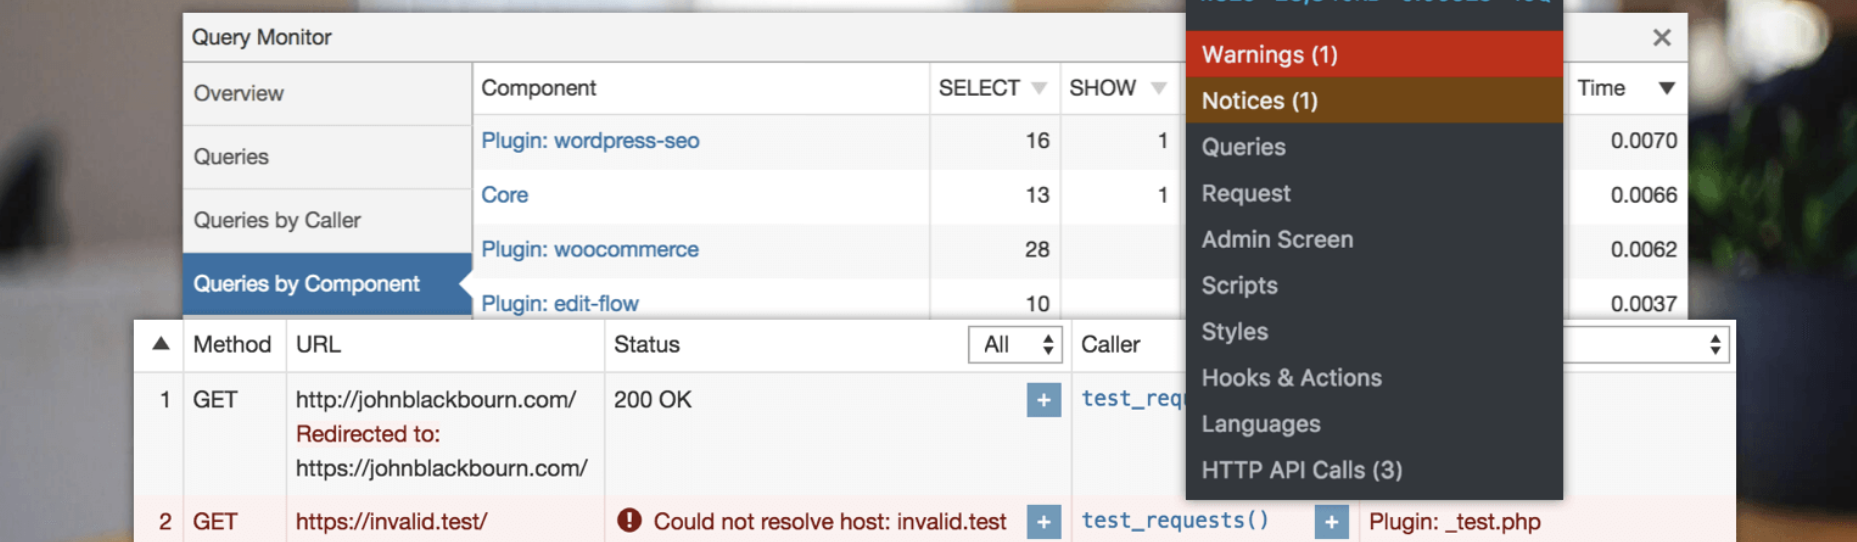
You can even use it to detect script, plugin, or database queries that can result in slow loading times. Plus, you can use it to solve debugging issues relating to redirects, translation files, ajax calls, and more.
2. New Relic
One of the most established names in the industry, New Relic delivers a robust debug, helping you monitor your UX, find broken permalinks, and improve performance. It’s a premium tool, however, you can try it for free for 14 days:
New Relic enables you to detect anomalies before they cause serious problems and gather data for troubleshooting. Since it was made by thousands of global developers, it’s considered to be a reliable, trustworthy tool. However, New Relic does come with a steep learning curve. Therefore, it might not be the best option for less experienced users.
3. Script Debug
Like WP_DEBUG, script debug is a built-in WordPress tool. It works by forcing WordPress to use the dev versions of core CSS and JavaScript files, instead of the minified versions, which are usually loaded. As such, it can be useful if you want to test changes to your .cc or .js files.
Although you can use plugins to enable this feature as we did before, you can also enable it manually through your wp-config.php file. Simply locate SCRIPT_DEBUG in your file and change the value to true.
4. Database Query Logging
This is a great tool to use if you’re having issues with your website’s database. You can track each query, the function that called the query, and see how long it took. However, enabling this feature can interfere with your site’s performance. Therefore, we recommend using it on a staging site first, and disable it as soon as you’re done.
Again, you have two options when it comes to enabling database query logging. You can find a plugin that will automatically carry out the process for you like WP Debugging. Or, you can locate your wp-config.php file and change the value of SAVEQUERIES to true.
Conclusion
Although it’s completely natural for bugs to arise in your code, it can impact web performance, and result in a poor UX. Whether it’s an issue with a plugin or a theme, debugging in WordPress enables you to find these errors and resolve them quickly.
To recap, here are two methods for debugging in WordPress:
- Enable debugging using a plugin like WP Debugging.
- Enable debugging manually by editing your wp-config.php file.
Do you have any questions about debugging in WordPress? Let us know in the comments section below!

0 Comments